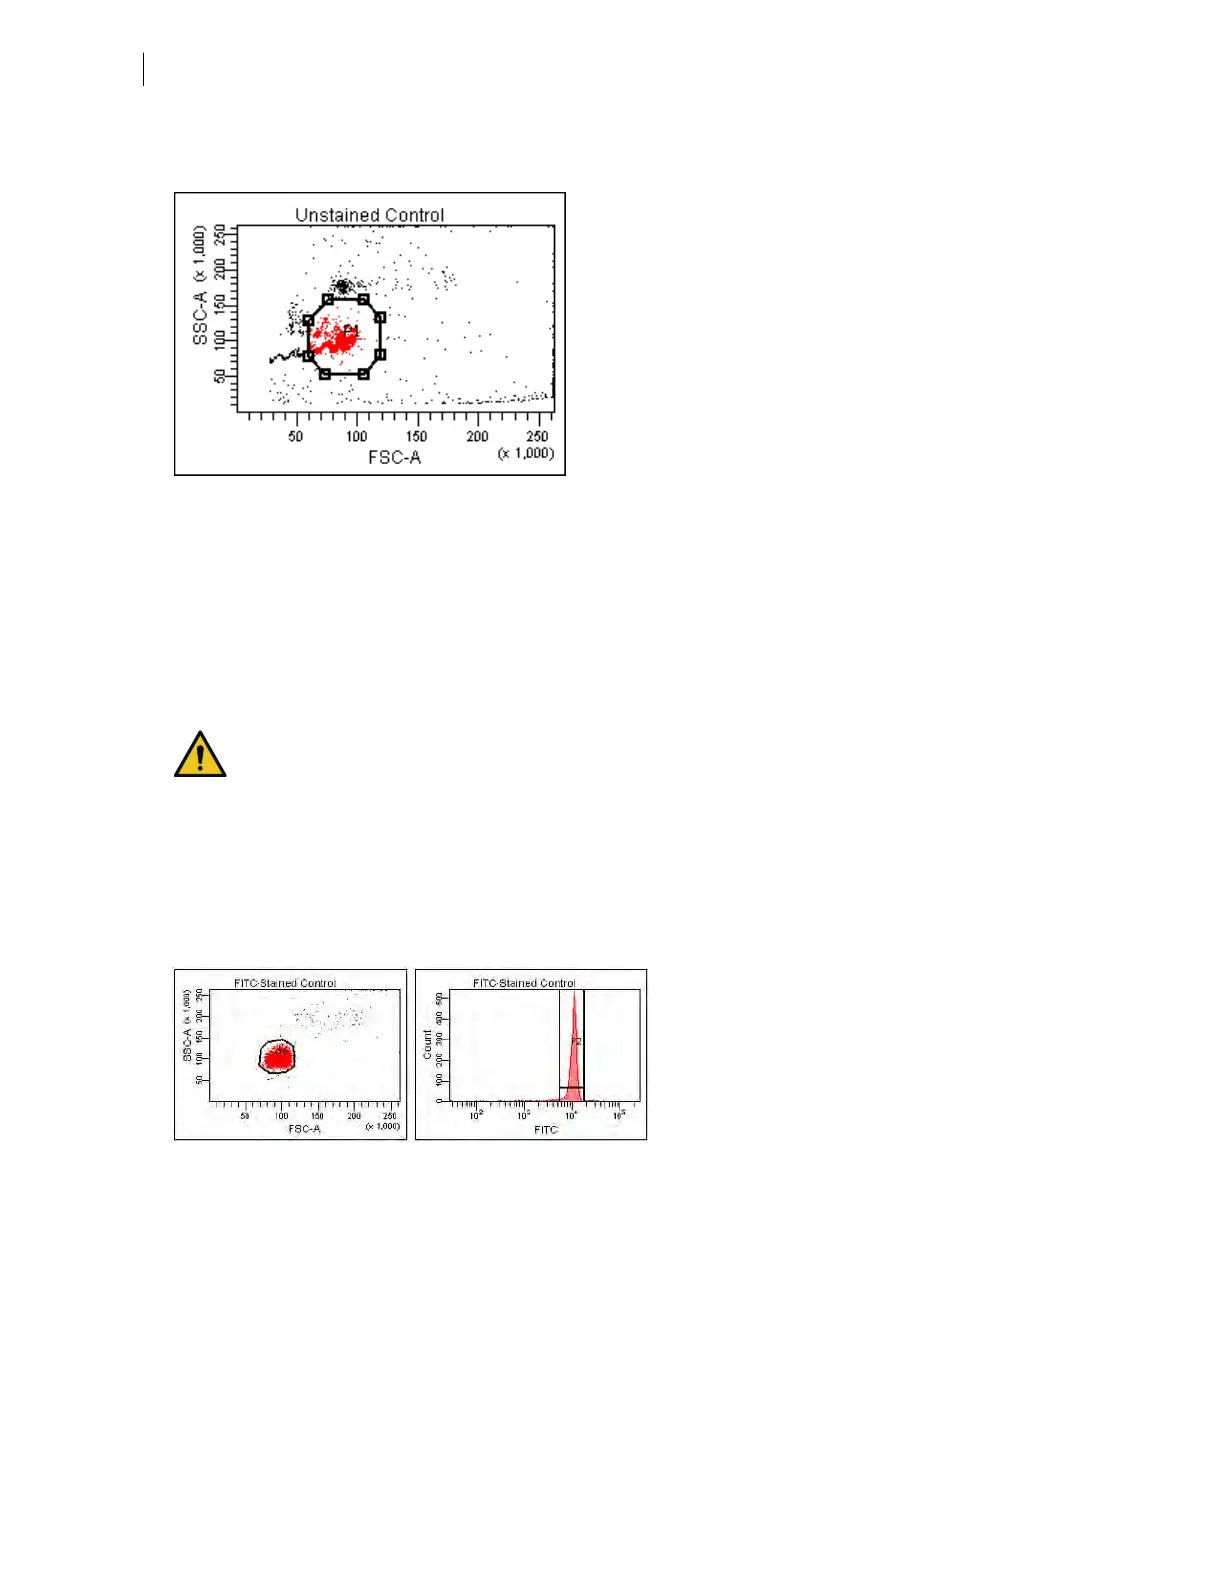
5. Verify that the population of interest is displayed appropriately on the FSC vs SSC plot and adjust voltages if
necessary.
6. Adjust the P1 gate to surround only the singlets.
7. Right-click the P1 gate and select Apply to All Compensation Controls.
The P1 gate on each stained control worksheet is updated with your changes.
8. Click Record Data.
9. When recording is finished, remove the unstained control tube from the cytometer.
10. Click Next Tube.
Do not change the PMT voltages after the first compensation control has been recorded. To calculate
compensation, all controls must be recorded with the same PMT voltage settings. If you need to adjust the
PMT voltage for a subsequent compensation control, you must record all compensation controls again.
11. Install the next tube onto the cytometer and repeat steps 8 through 10 until data for all stained control
tubes has been recorded.
12. Double-click the first stained control tube to display the corresponding worksheet.
13. Verify that the snap-to interval gate encompasses the positive population.
14. Repeat steps 12 and 13 for the remaining compensation tubes.
Next step
After you have recorded data for each single-stained control, calculate compensation as described in
Calculating compensation (page 81).
80 BD FACSymphony™ A5 SE User's Guide