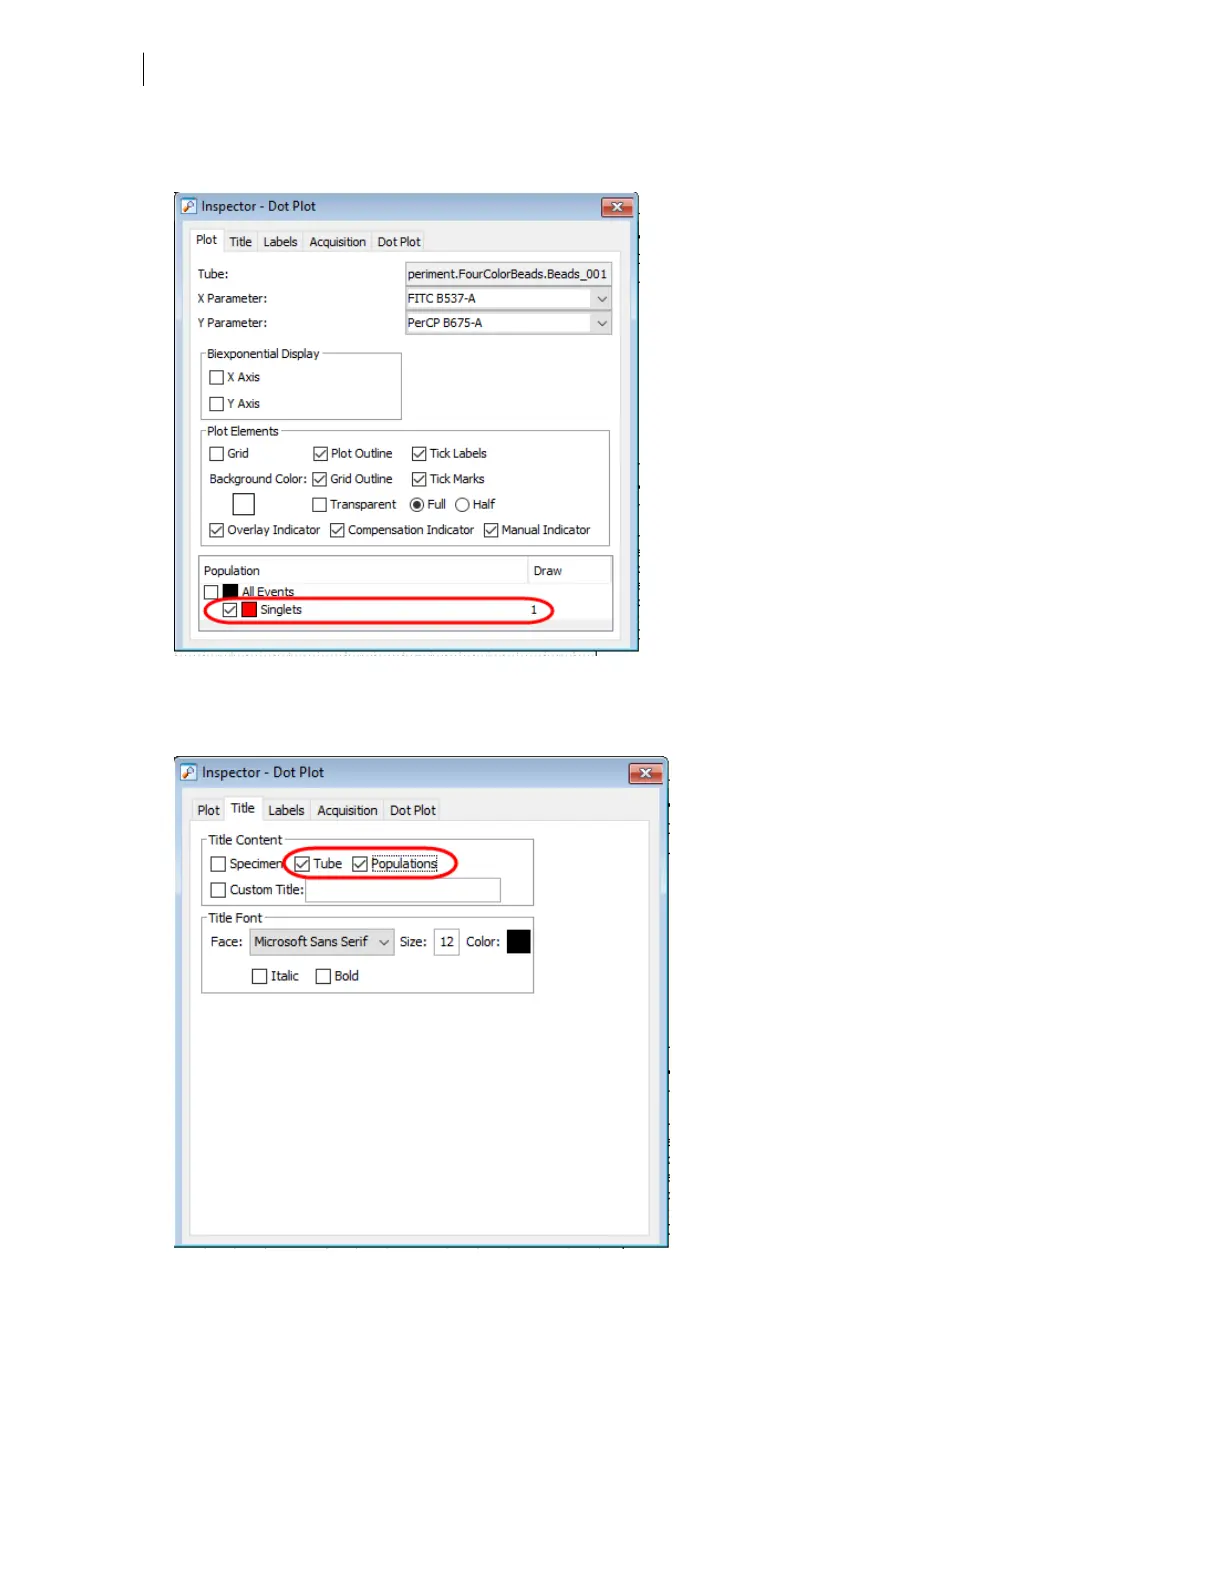
7. Select all plots except the FSC vs SSC plot, and use the Plot tab in the Inspector to show only the singlet
population.
8. Select all plots, and click the Title tab in the Inspector.
9. Select the Tube and Populations checkboxes to display their names in plot titles.
10. On all fluorescence plots:
l
In the FITC vs PE plot, draw a gate around the FITC-positive population. Name the population FITC
positive in the population hierarchy.
88 BD FACSymphony™ A5 SE User's Guide