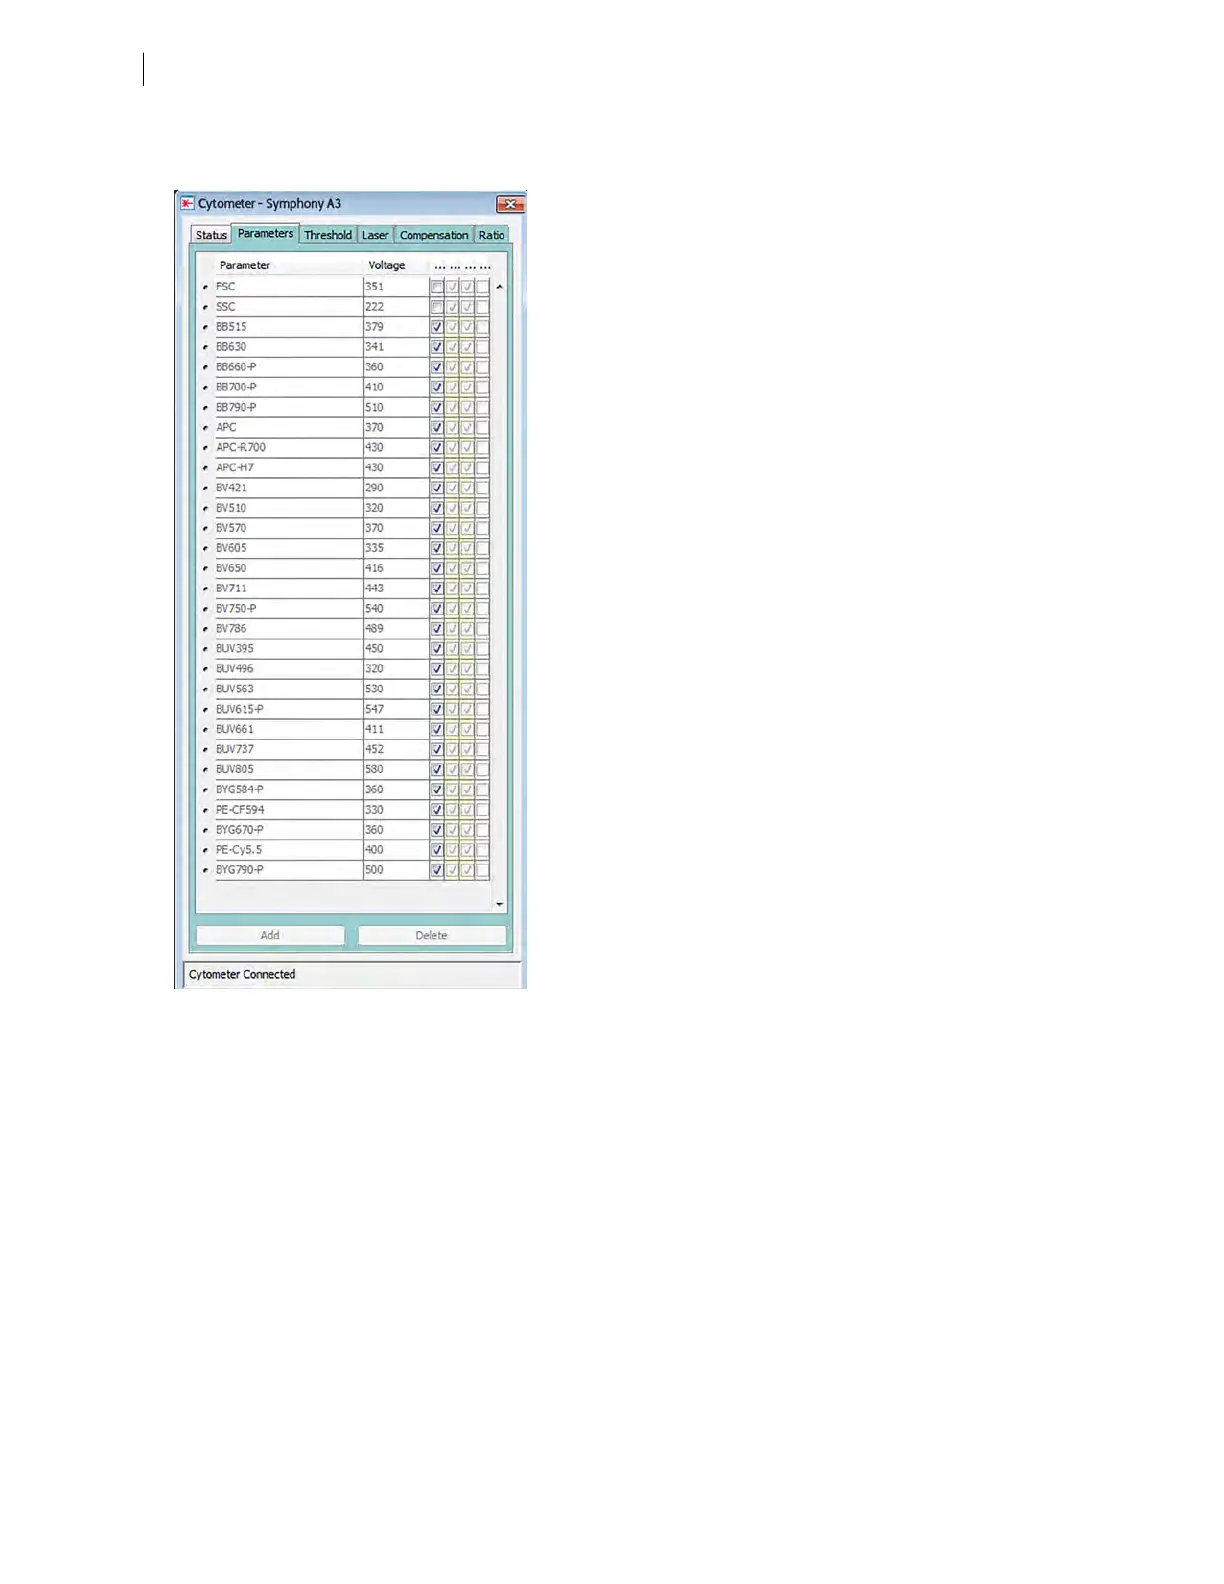
3. In the Inspector, click the Parameters tab and select the H checkbox to select the height for each
parameter.
4. On the global worksheet, create the following plots and histograms:
l
FSC vs SSC dot plot
l
FSC-H and FSC-A histogram
l
FITC-H and FITC-A histogram
l
APC-H and APC-A histogram
5. Create a P1 gate in the FSC vs SSC plot, and show only the P1 population in all histograms.
6. Create three statistic views showing the following:
l
FSC-H and FSC-A means for P1
l
FITC-H and FITC-A means for P1
l
APC-H and APC-A means for P1
98 BD FACSymphony™ A5 SE User's Guide