Chapter 3: Running Samples 61
8 Display log decade gridlines on the fluorescence histograms.
• Select all fluorescence histograms on the Unstained Control worksheet.
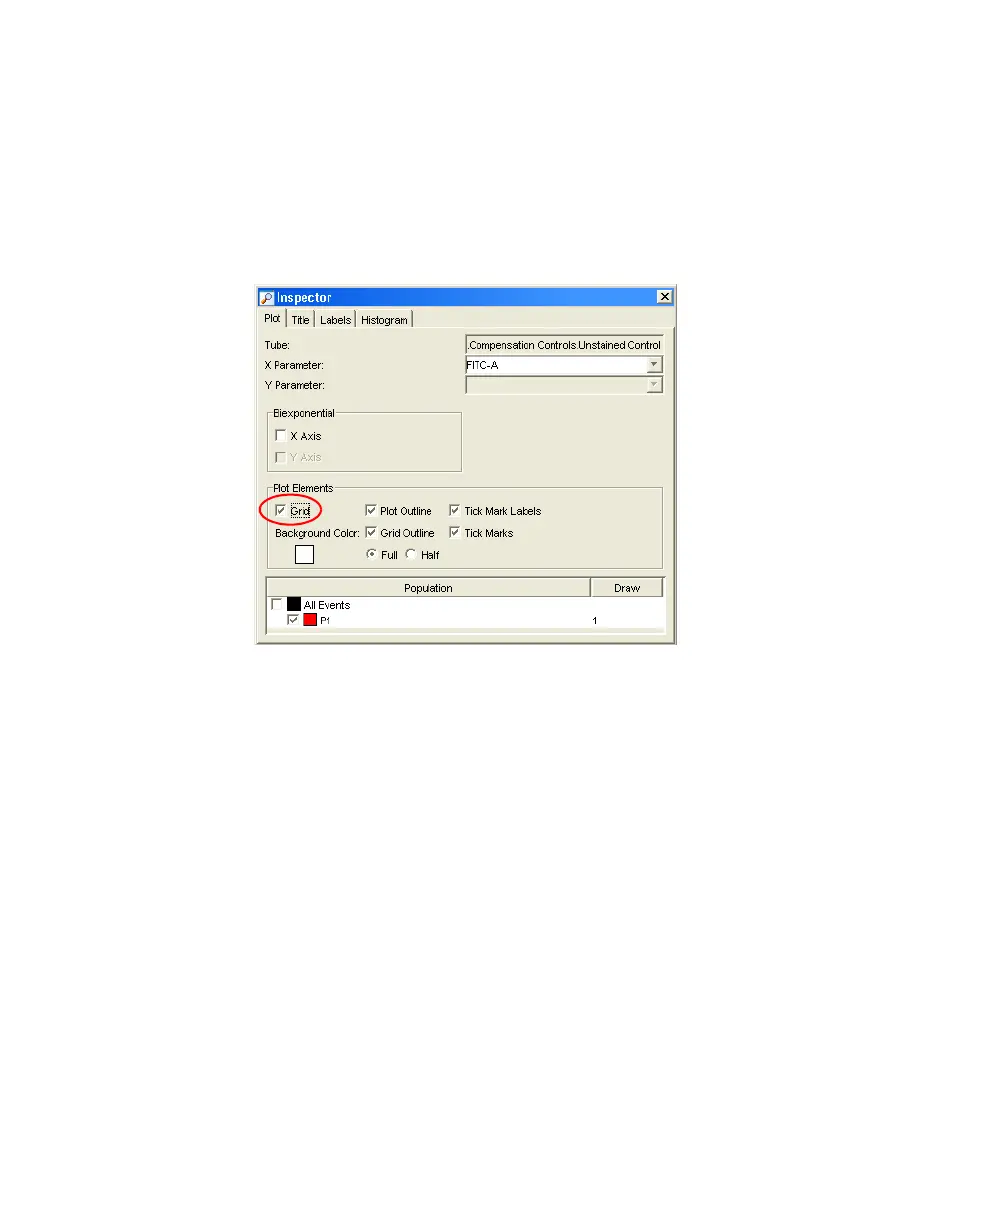
• In the Plot Inspector, select the Grid checkbox (Figure 3-7).
Figure 3-7 Inspector for fluorescent plots
In a four decade log display, values are displayed from 26–262,143. The
first log decade ranges from 26–262. Gridlines are used to delineate log
decades on plots.
9 For each fluorescence parameter, adjust PMT voltages to place the negative
population within the first log decade (Figure 3-8 on page 62).
To adjust voltage settings, use controls in the Parameters tab in the
Instrument window. Refer to the BD FACSDiva Software Reference
Manual for assistance.
LSR2.book Page 61 Tuesday, April 25, 2006 3:34 PM
 Loading...