S10/S12/S10A/S12A Patient Monitor User’s Manual
8-27
2. Select the 【QT View】 button at the bottom of the menu.
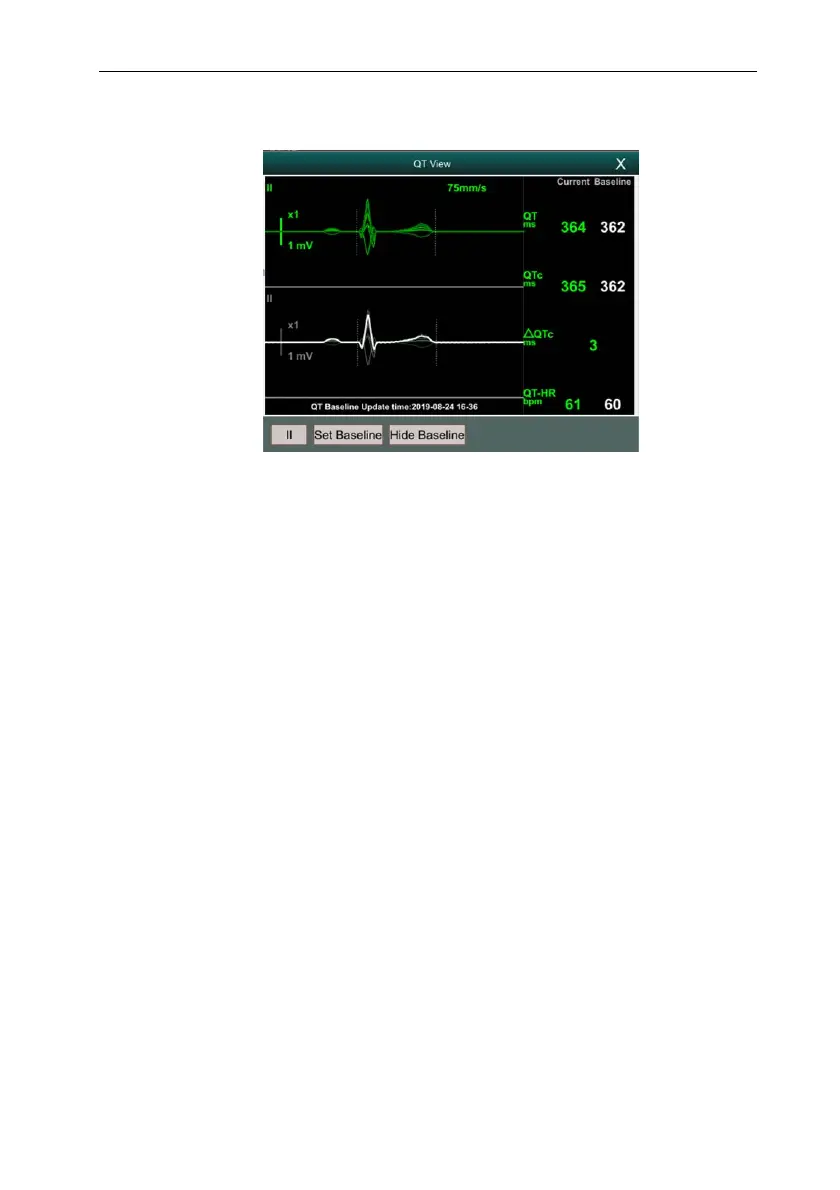
The following figure shows an example of QT View:
The current waveform is displayed at the top of the view, and the color is the
same as the ECG waveform, usually green.
The baseline segment is displayed below in white.
The starting point of QRS complex and the ending point of T wave are
marked with vertical lines.
In some cases, the algorithm may not be able to give QT measurement results
because the waveform does not meet the requirements. At this time, the reason
that cannot be analyzed will be displayed below the QT parameter area in QT
View. In addition, a prompt message "QT cannot be analyzed" will be
displayed in the technical alarm information area of the main interface.
Select the lead label at the lower left of QT View, switch leads, and highlight
the waveforms of the corresponding leads.
8.8.5. Setting the QT Baseline
Setting QT baseline is helpful to quantify QTc changes. After QT valid values appear,
if you do not set QT baseline within 5 minutes, the monitor will automatically set QT
baseline.
The steps for manually setting QT baseline are as follows:
1. Select the 【Set Baseline】 button below QT View.
2. Select 【OK】 in the pop-up dialog box to set the current QT parameter value
 Loading...