75
EN
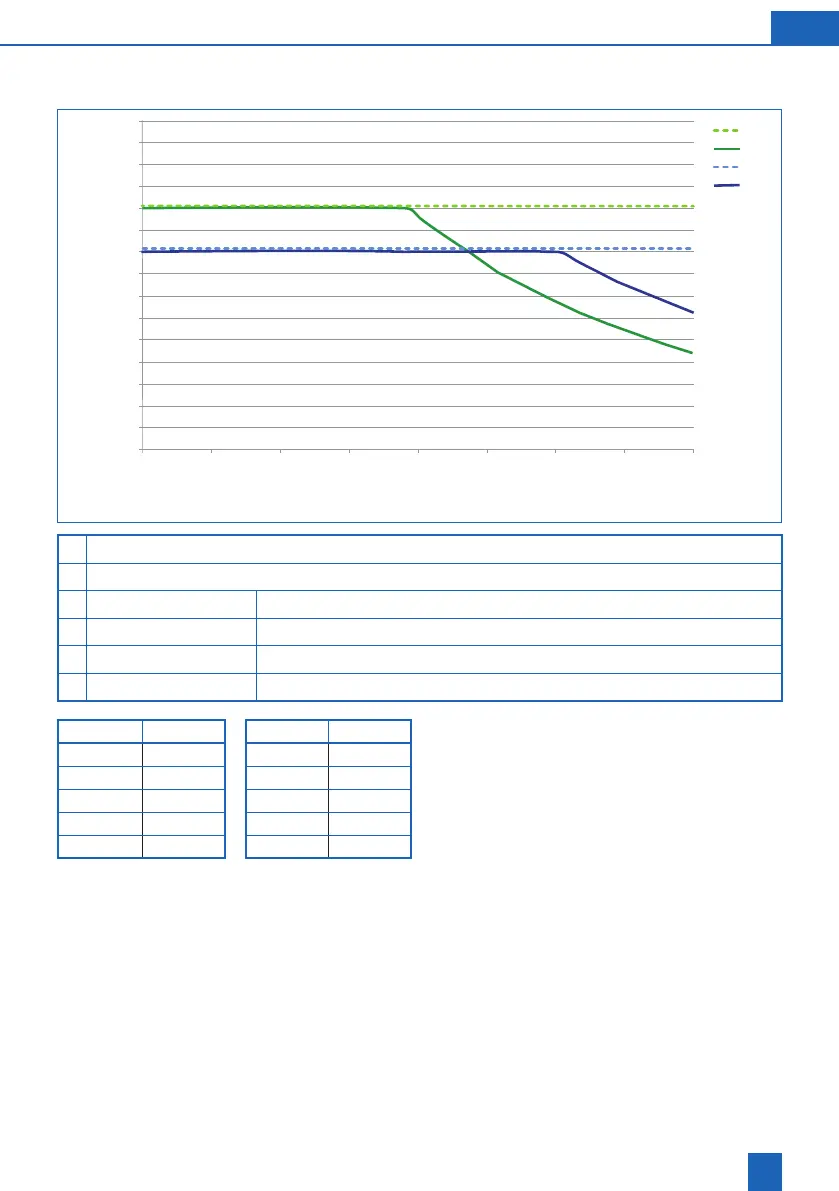
17.2 Diagram of peak ow
1000
1200
1400
1600
1800
2000
2200
2400
2600
2800
3000
3200
3400
3600
3800
4000
1,0 1,5
2,0
2,5 3,0 3,5 4,0 4,5 5,0
B
A
1
2
3
4
A
B
1 BWT Perla 1 bar pressure loss
2 BWT Perla
3 BWT Perla Seta 1 bar pressure loss
4 BWT Perla Seta
mmol/l °dH mmol/l °dH
1.0 5.6 3.5 19.6
1.5 8.4 4.0 22.4
2.0 11.2 4.5 25.2
2.5 14.0 5.0 28.0
3.0 16.8
Peak ow
greater than 1 bar.
Operating ow
(see DIN EN 14743 for details).
Nominal ow
temperature of 15 °C when the blending is closed.