EasyManuals Logo

Casio ClassPad 330 User Manual

Casio ClassPad 330
941 pages
To Next Page IconTo Next Page
To Previous Page IconTo Previous Page
Page #769 background imageLoading...
Page #769 background image
20060301
u
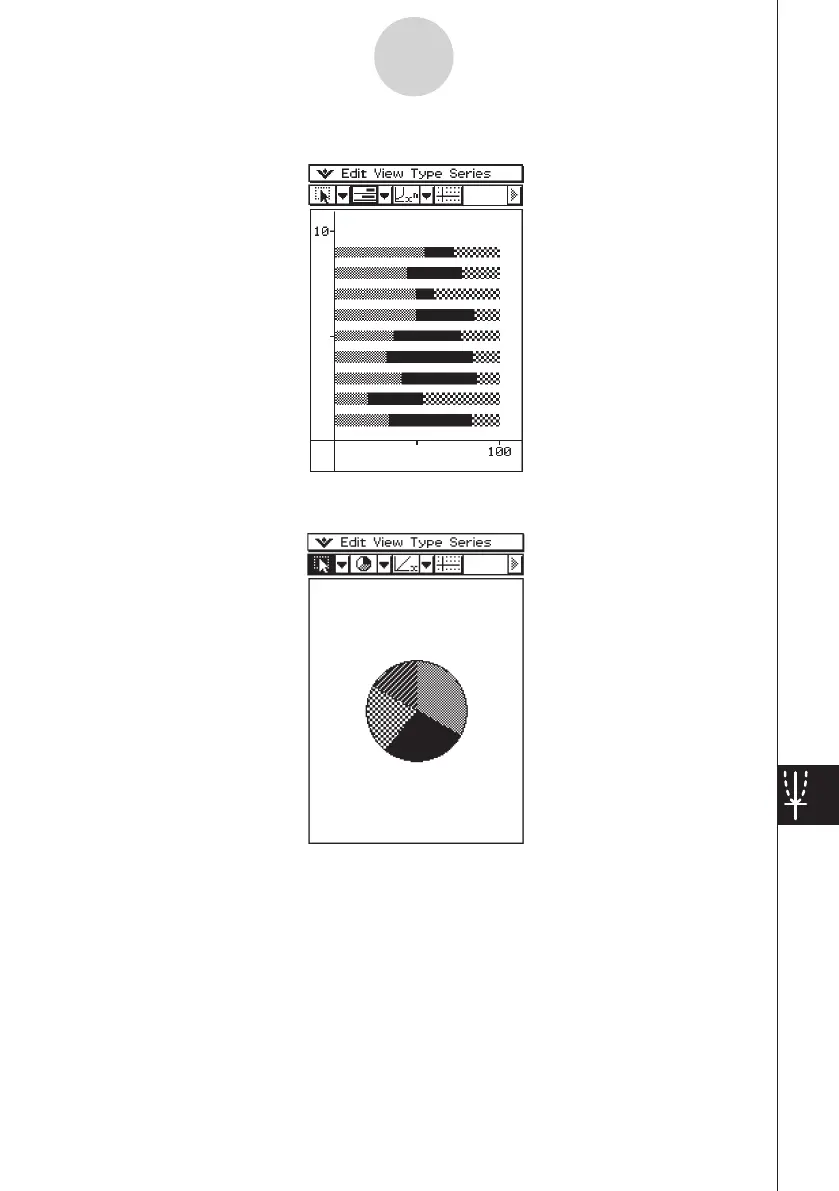
[Graph] - [Bar] - [100% Stacked] (
"
)
u
[Graph] - [Pie] (
Z
)
When you select a pie chart, only the first series (row or column) of the selected data is
used.
Tapping any of the sections of a pie graph causes three values to appear at the bottom of
the screen: the cell location, a data value for the section, and a percent value that indicates
the portion of the total data that the data value represents.
13-8-6
Graphing

Table of Contents

Other manuals for Casio ClassPad 330

Questions and Answers:

Question and Answer IconNeed help?

Do you have a question about the Casio ClassPad 330 and is the answer not in the manual?

Casio ClassPad 330 Specifications

General IconGeneral
BrandCasio
ModelClassPad 330
CategoryCalculator
LanguageEnglish

Related product manuals