20060301
u
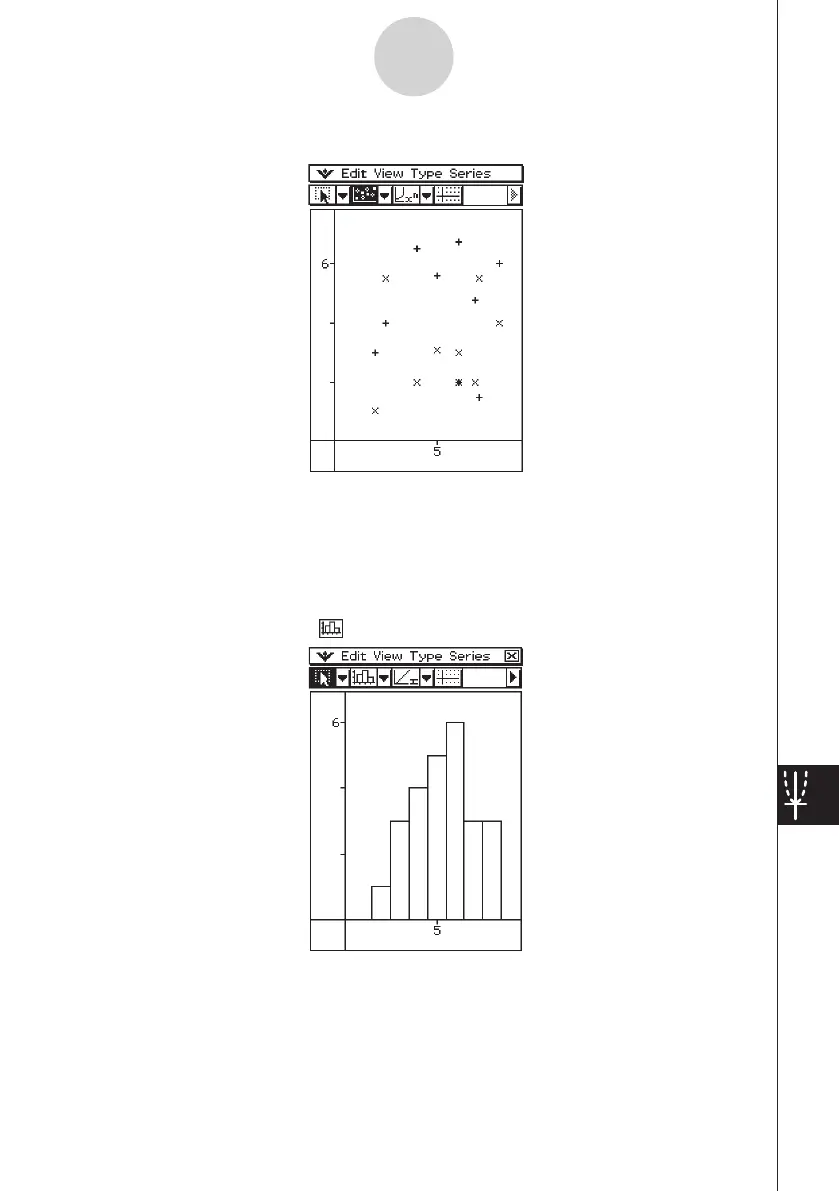
[Graph] - [Scatter] (
X
)
13-8-7
Graphing
• In the case of a scatter graph, the first series (column or row) of selected values is used
as the
x
-values for all plots. The other selected values are used as the
y
-value for each of
the plots. This means if you select four columns of data (like Columns A, B, C, and D), for
example, there will be three different plot point types: (A, B), (A, C), and (A, D).
• Scatter graphs initially have plotted points only. You can add lines by selecting [Lines] on
the [View] menu.
u
[Graph] - [Histogram] (
)
• When you select a histogram graph, only the first column of the selected data is used.