20060301
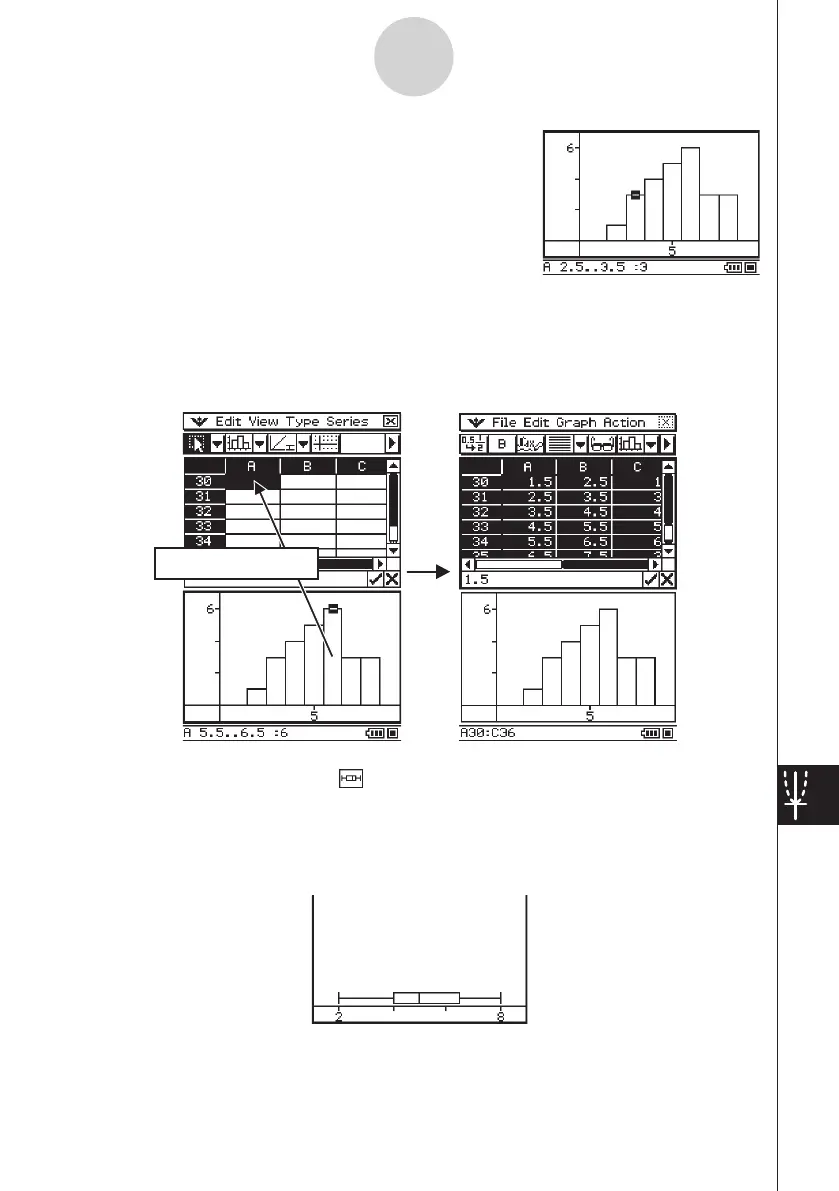
• Tapping any of the bins of a histogram graph causes three
values to appear at the bottom of the screen. The first two
values (from the left) indicate the range of the selected bin,
while the third value indicates the quantity of the selected
bin.
• You can specify the bin width after drawing a histogram graph. On the Graph window that
shows the histogram, tap [Bin Width] on the [Series] menu.
• Dragging any of the bins of a histogram graph to a cell in the spreadsheet window will
create a table containing the values of the histogram graph, starting from the cell where you
dropped the data.
u
[Graph] - [Box Whisker] ( )
This type of graph lets you see how a large number of data items are grouped within specific
ranges. A box encloses all the data in an area from the first quartile (Q1) to the third quartile
(Q3), with a line drawn at the median (Med). Lines (called whiskers) extend from either end
of the box up to the minimum (Min) and maximum (Max) of the data.
• When you select a box whisker graph, each column will be displayed as a separate box
whisker.
13-8-8
Graphing
Drag & drop