2-76
1010PVNFM-3A
Section 2
The Test Facilities Graph Screen
NOTE: The following is intended for 1010 VFMT systems with Graphic Displays only.
For VFMT capable 1010X systems (with or without digital displays) or 1010PVN
blind systems, the digital receive signal can only be viewed as a text dump
over the RS-232 output (i.e., by pressing the [F1] key and then the period key
[.] ). Access to the digital damping parameters can be found in the [Site Setup]
menu cell of the Diagnostic Data menu. Refer to the appropriate System 1010
field manual for details.
When operating in the transit time mode the Test Facilities Graph Screen is an exceptional
diagnostic tool for troubleshooting problem applications or simply determining receive signal
quality. The primary function of this screen is the display of the digitized receive signal wave-
form with similar appearance and function of a digital oscilloscope. This screen also allows
the user to override some of the 1010 default settings by permitting adjustment to the mea-
sured transit time, the digital averaging and the zero crossover used in the measurement of
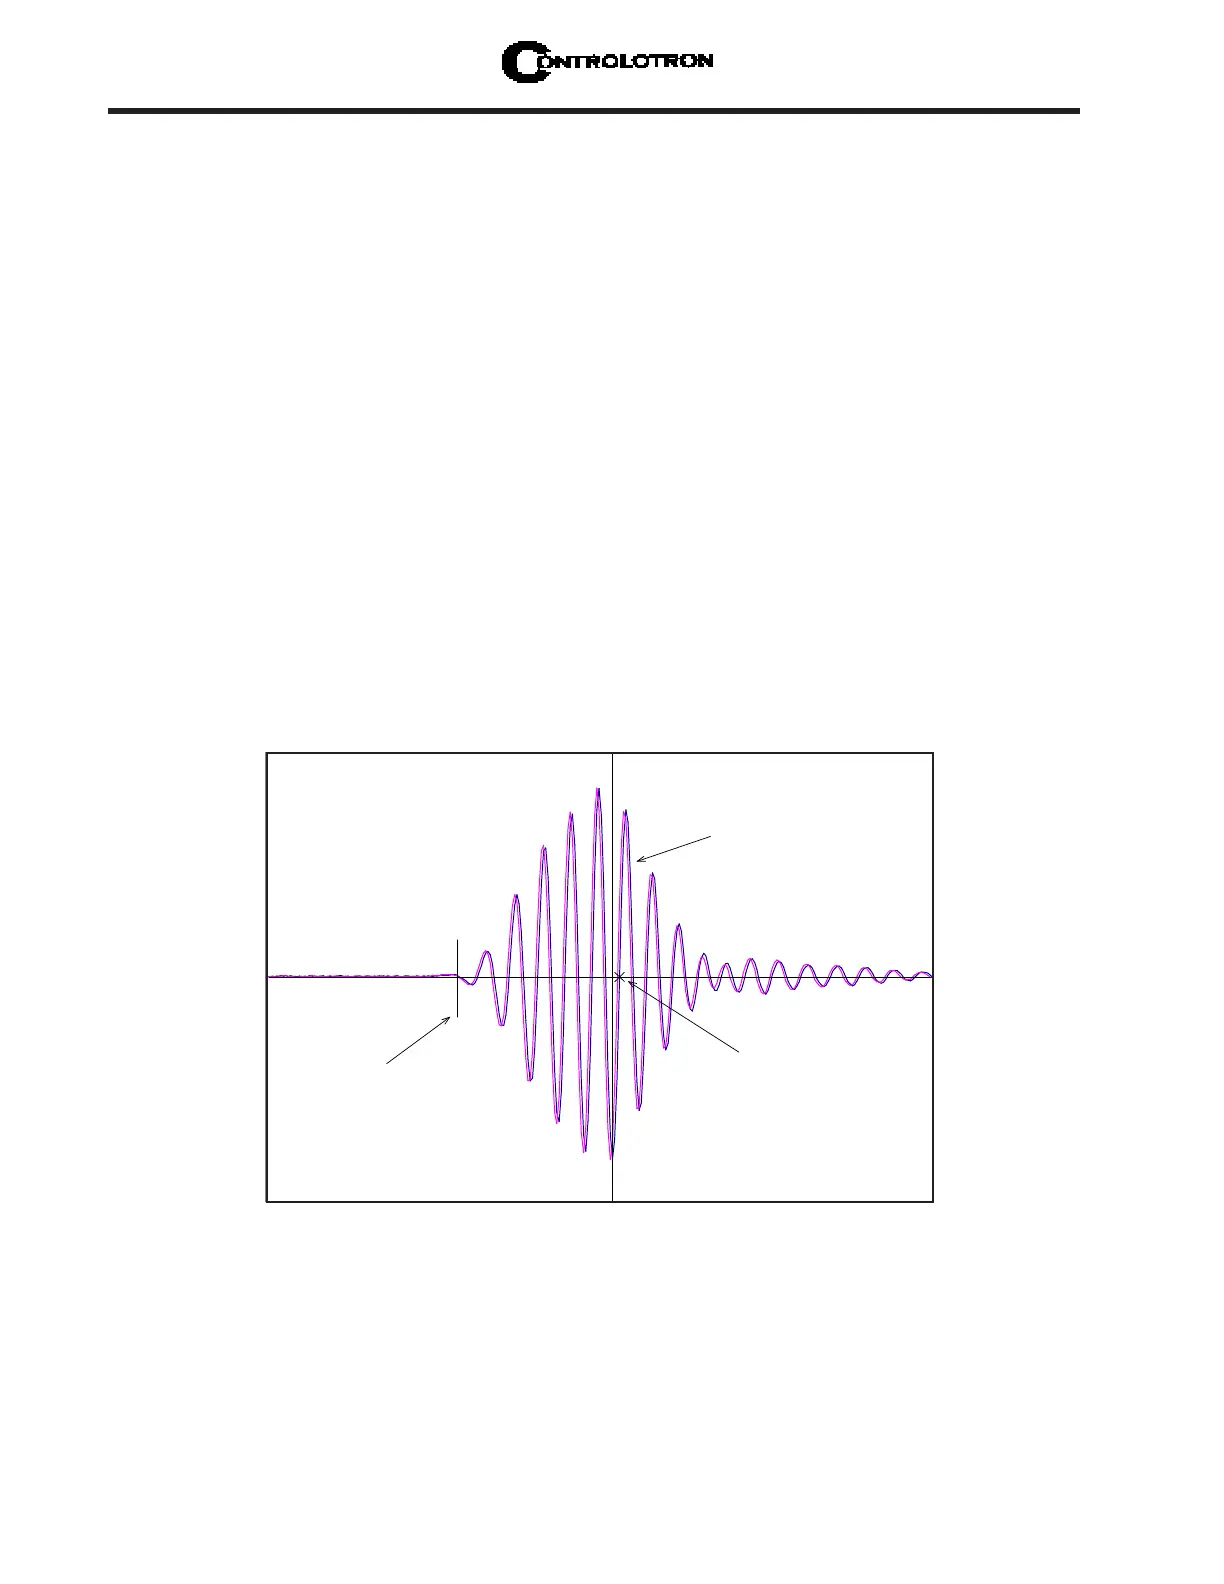
the up/down transit time difference. The figure shown on the next page is a representation of
the 1010 diagnostic graph.
NOTE: The Test Facilities Graphic Screen requires significant CPU overhead. The
1010 meter should not be left in this mode during normal operation, where the
Datalogger is the primary output, or during calibration work.
F 0.73
VS 1469.73
[ ] 1691:1929 476
D 4:4 4
Tn 55.06 55.06
d T 3.11
S 72 1
SN 124:1
CQ 17:1
Digitized Receive Signal
TN marker
Crossover Marker
Command Line appears here
91
3