60
Cluster
North America – Clicking this will allow you to change the country.
English – Clicking this will allow you to change the language of the page.
(Username) – Clicking this will open a list with User Center (used for editing your profile), Mod-
ify password (used to change your password), and Logout (to logout of this account)
Name Description
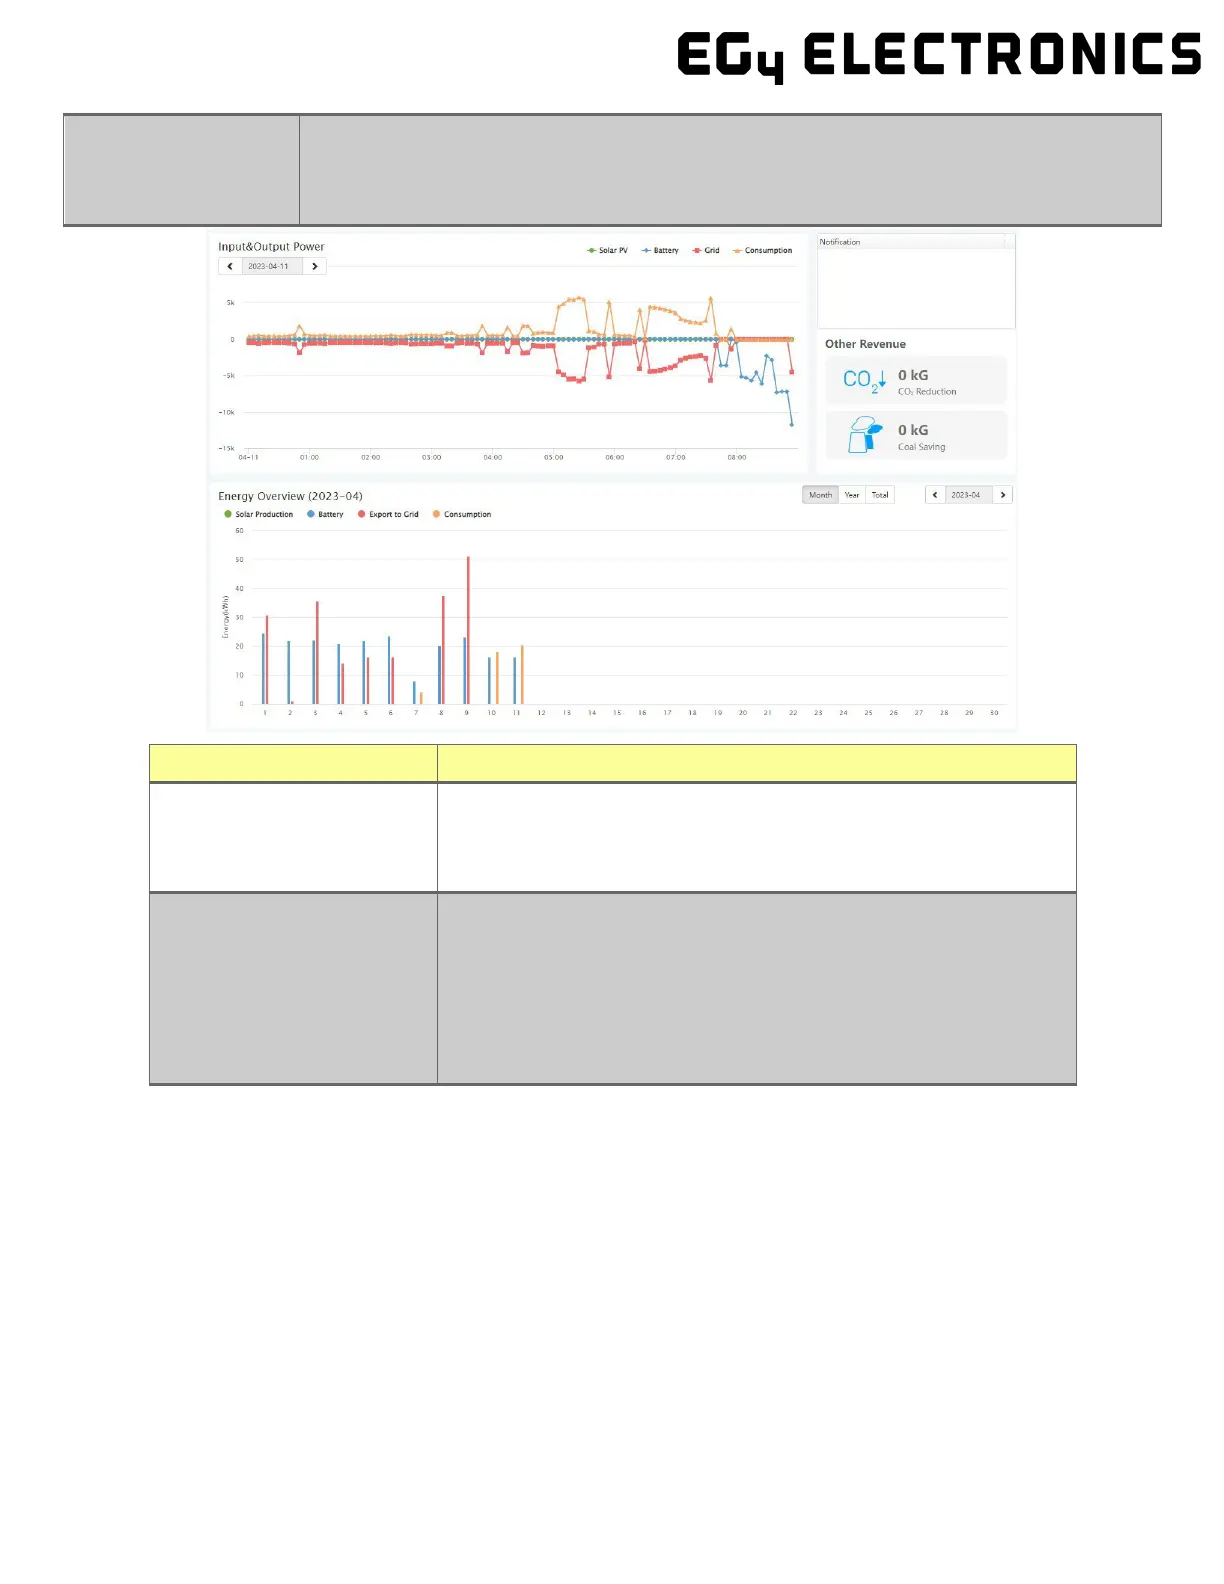
Input & Output Power
This chart shows the power curve for each day, including solar
power, battery charge/discharge power and grid import/export
power and consumption. Hovering over an item name will highlight
it in the chart. Clicking it will remove it from the list.
Energy Overview
This chart shows energy production and consumption for each day,
including solar production, battery, grid export and consumption.
Hovering over an item name will highlight it in the chart. Clicking it
will remove it from the list.
Selecting ‘Month’ will show the energy statistics for each day.
Selecting ‘Year’ will show energy for each month.
Selecting ‘Total’ will show energy for each year.
8.3.3 Data tab
Data view displays additional in-depth running data, including technical details for PV, battery, grid, and
loads, that is helpful for analysis and maintenance.
Five categories make up the data view: "Chart," "Energy," "Historical data," "Local data," and "History
event." For more details on each component, please see the following sections.
Chart
Chart shows how key parameters of “PV side”, “Battery”, “AC Side” and “Backup Output” change over
time over a 24 period.
 Loading...