User Manual Chapter 7
GFK-1742F Jan 2020
Programmed Motion 191
Types of Acceleration
Linear Acceleration
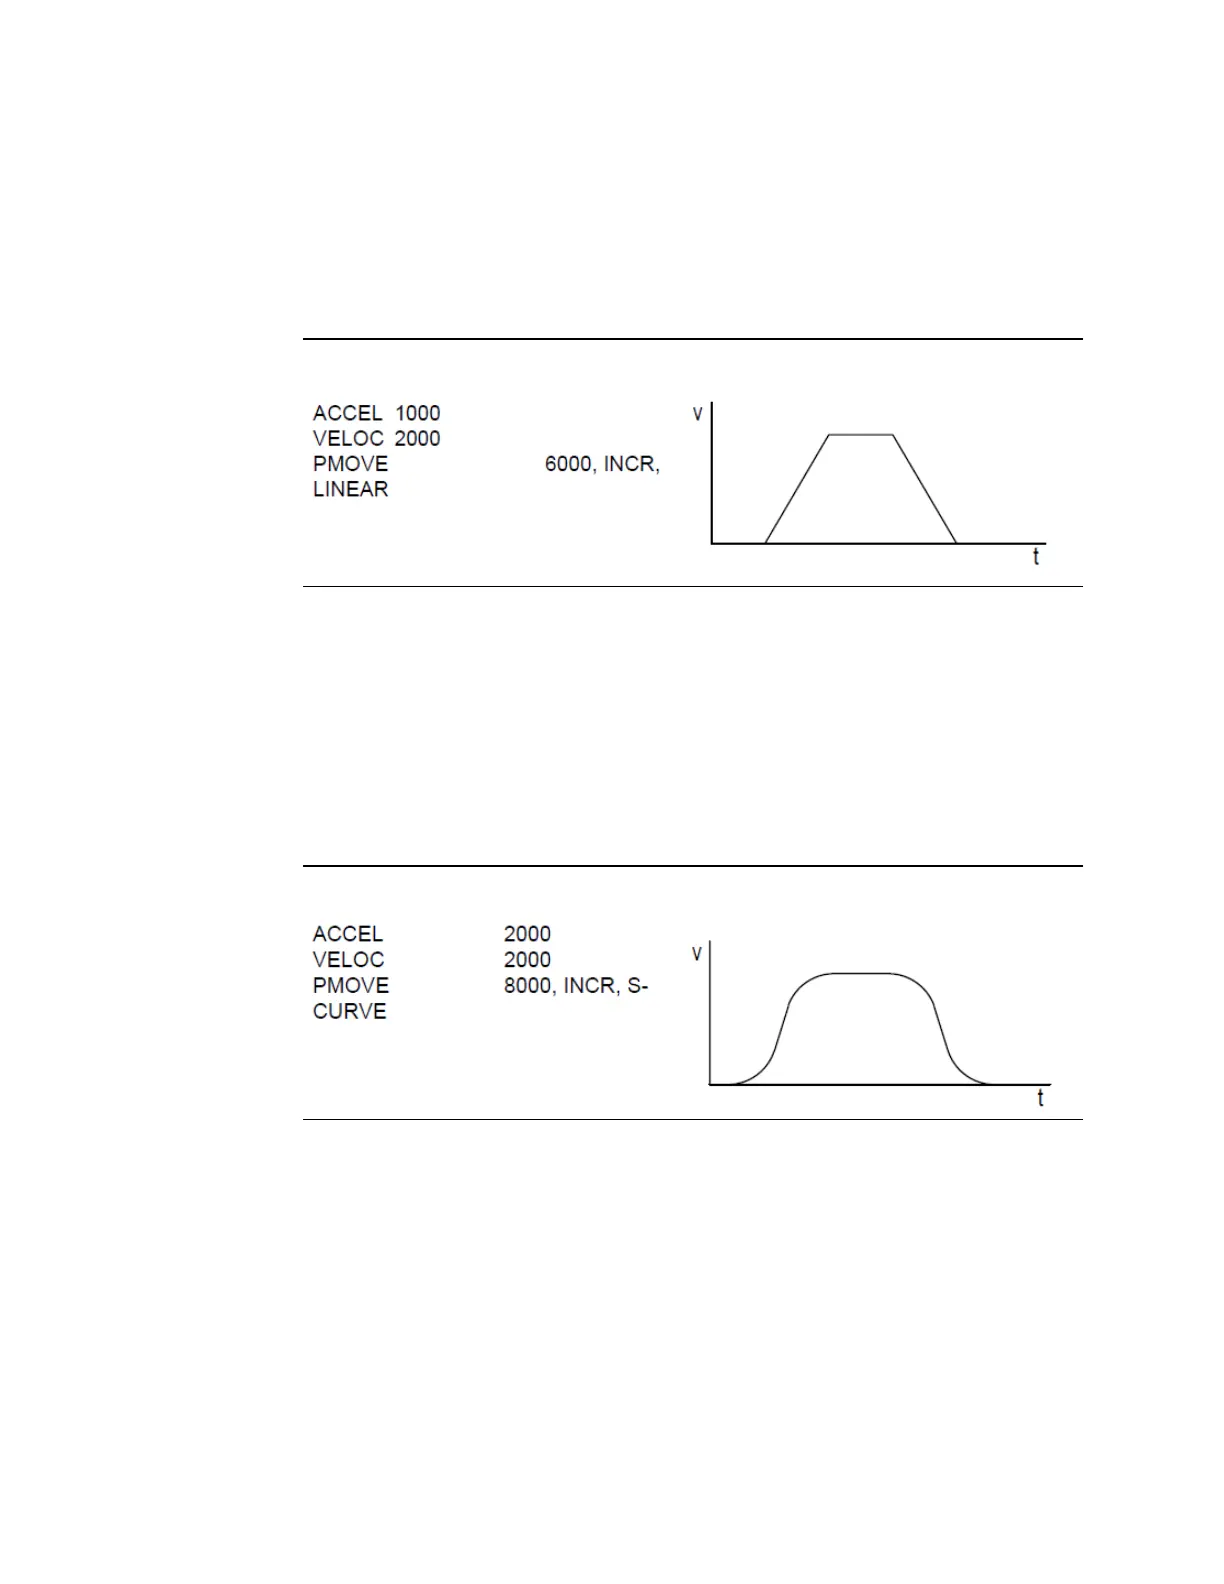
A sample linear move profile that plots velocity versus time is shown in Figure 69. As
illustrated, a linear move uses constant (linear) acceleration. The area under the graph
represents the distance moved.
Figure 69: Sample Linear Motion
S-Curve Acceleration
An S-Curve motion sample, plotting velocity versus time, is shown below. As illustrated, S-
Curve acceleration is non-linear. When the move begins, the acceleration starts slowly and
builds until it reaches the programmed acceleration. This should be the midpoint of the
acceleration. Then, the acceleration begins decreasing until it is zero, at which time the
programmed velocity has been reached. An S-Curve move requires twice the time and
distance to accelerate and decelerate that a comparable linear move need. The area under
the graph represents the distance moved.
Figure 70: Sample S-Curve Motion
 Loading...