- 45 -
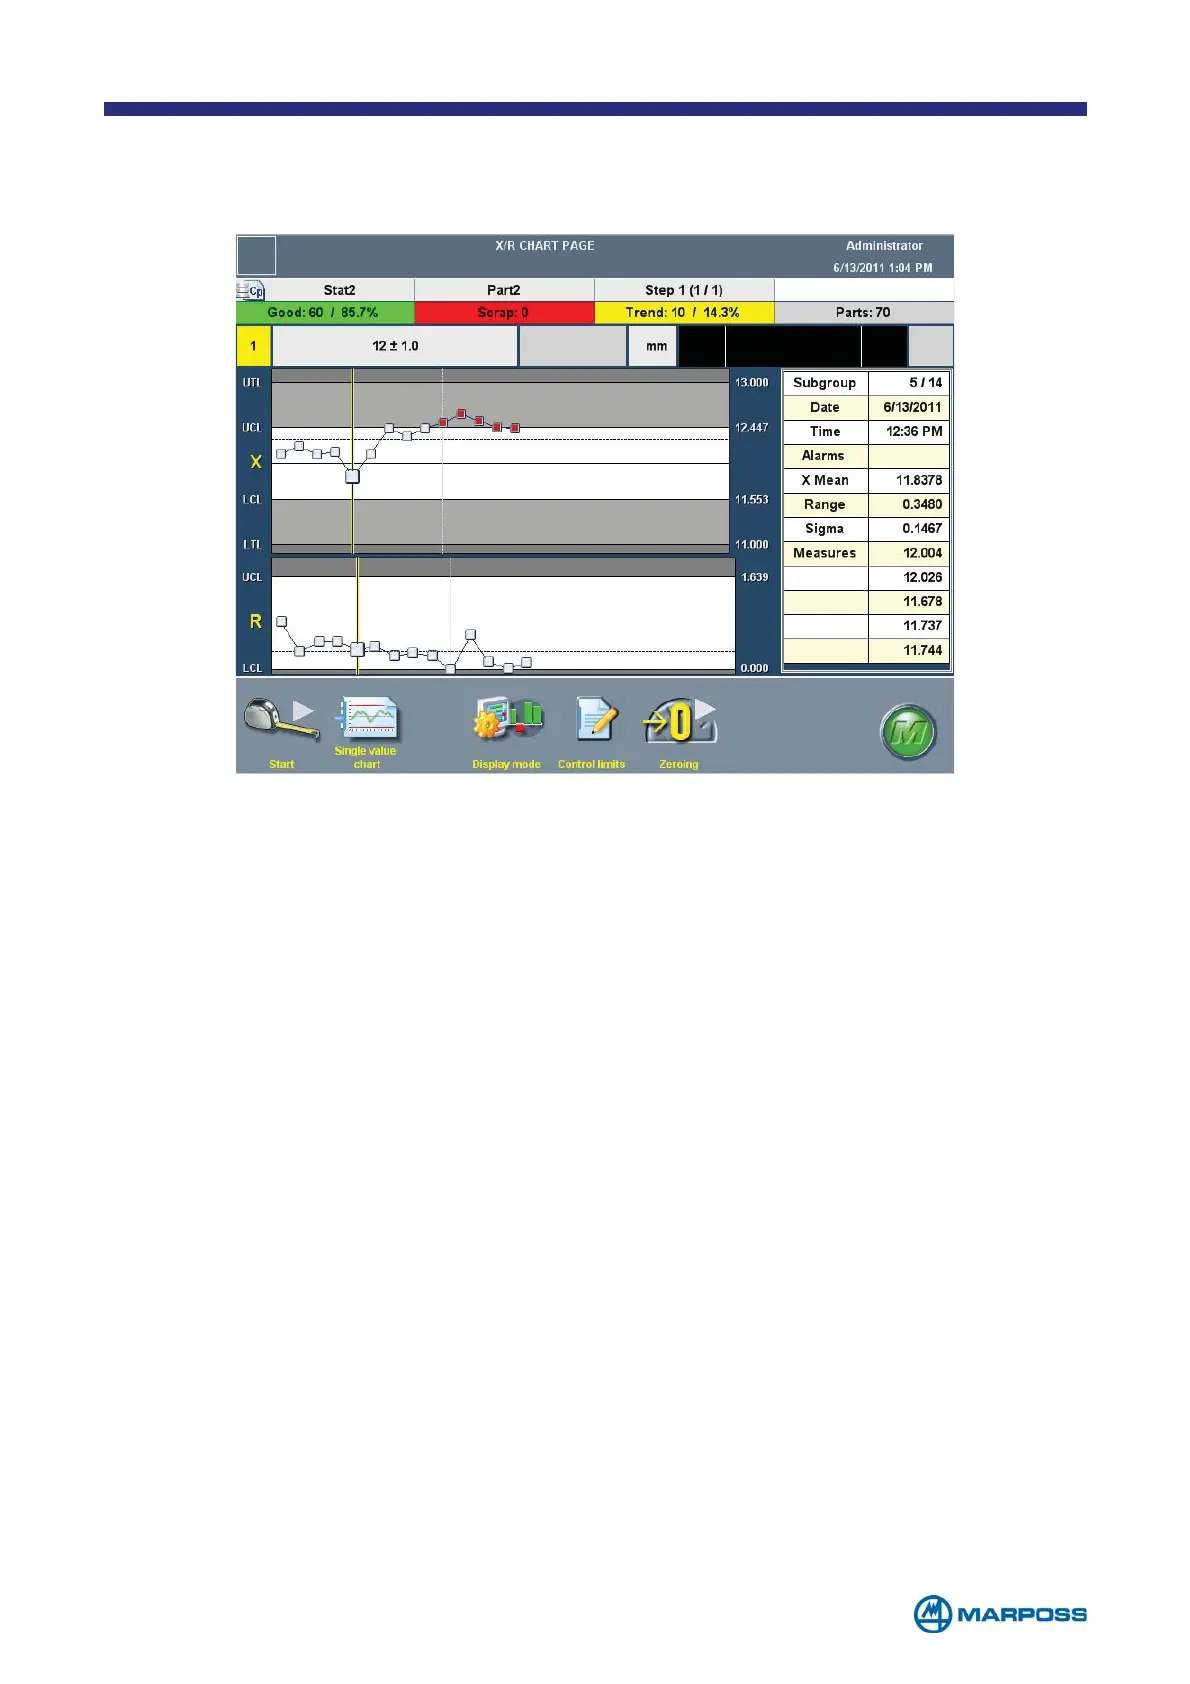
5.2 Control chart
Use the CONTROL CHART page to view the graph and carried out acquisition cycles.
The adjacent table contains the numerical statistical results corresponding to the
C
ONTROL CHART. The executed measurement STEP, delete and modify PROGRAMMING
functions are the same as on the M
AIN MEASURE PAGE.
• S
UBGROUP: tapping on any points of the chart, it is possible to get more informa-
tion on the subgroup represented. Information like samples value and alarms
are shown on the table available on the right side of the screen.
• S
INGLE VALUE CHART: tap this button to display the page containing the SINGLE
VALUE CHART for the BATCH in use.
• T
RACING: tap the TRACING button to insert the TRACING DATA.
• D
ISPLAY MODE: tap this button to change the displayed charts from X/R to X/S.
• C
ONTROL LIMITS: tap this button in order to modify the chart control limits.
• Z
EROING: tap on ZEROING to carry out the device electrical zeroing procedure.