- 88 -
Quality control chart
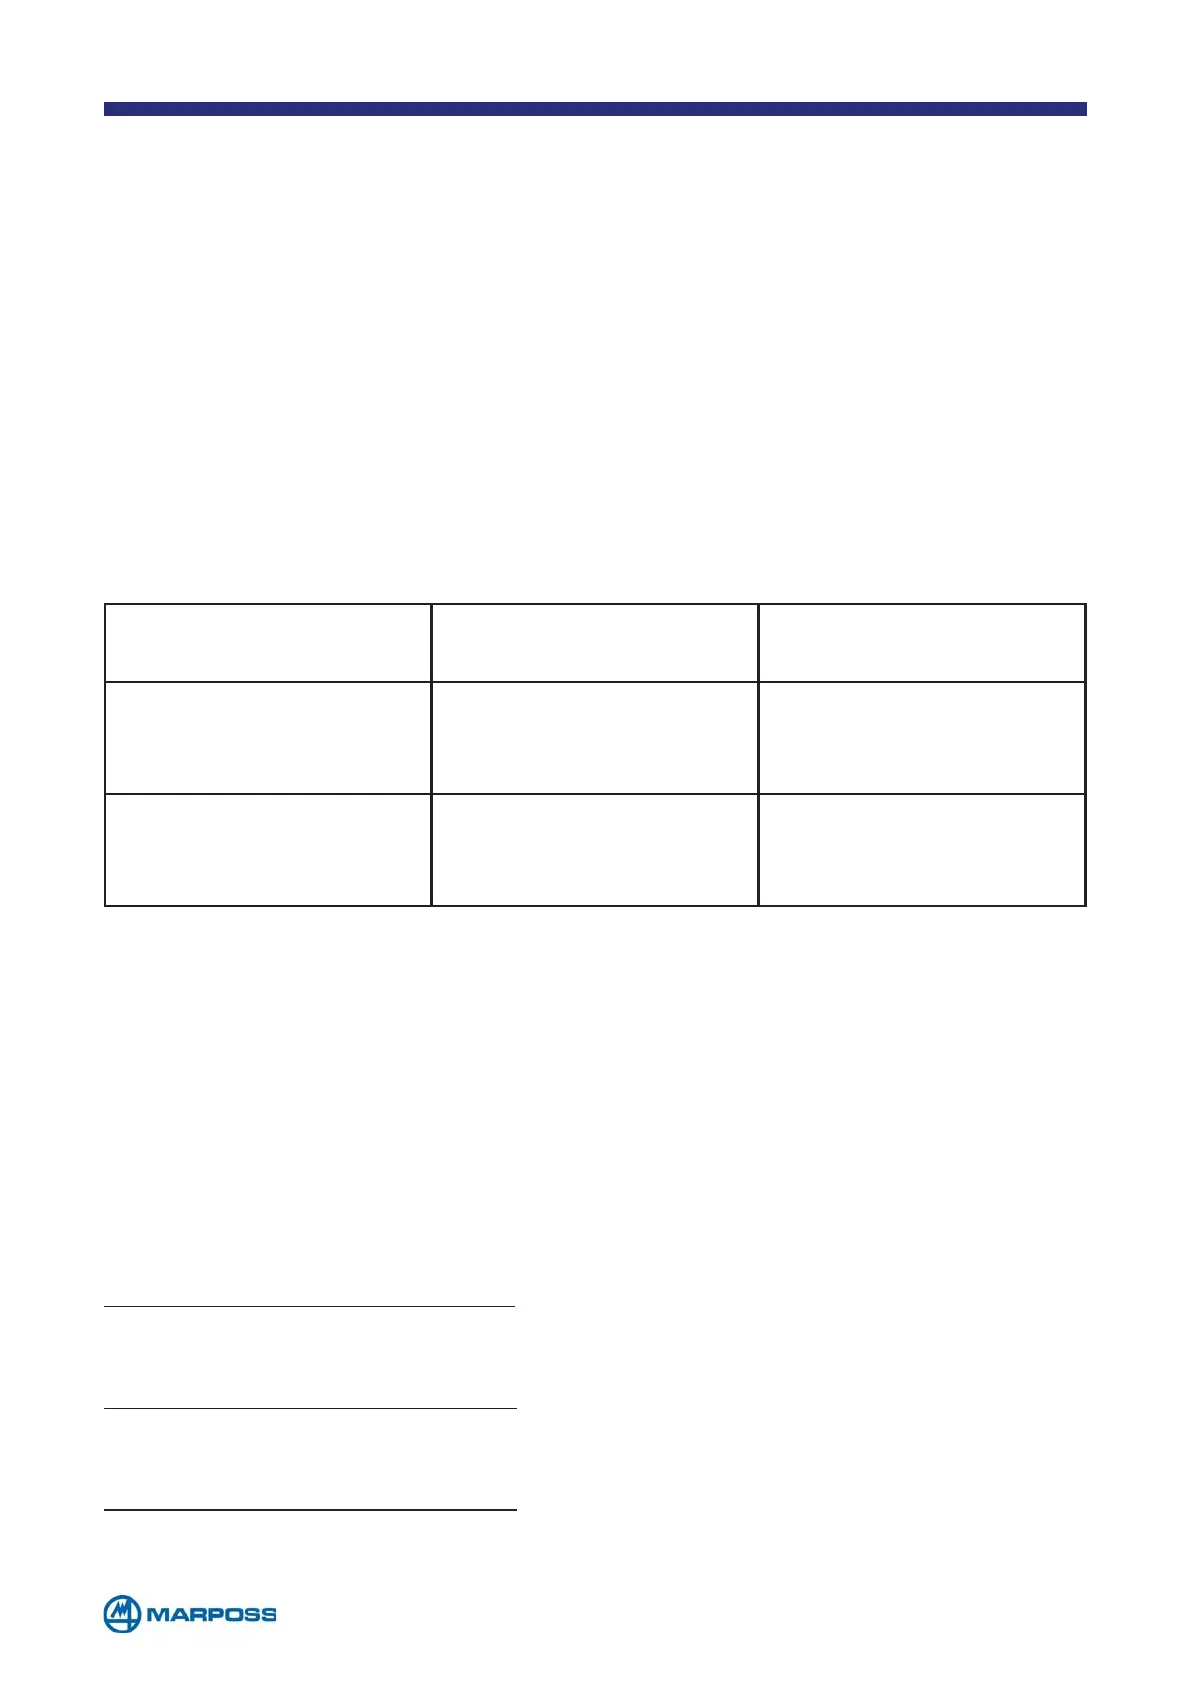
Standard XR and XS chart for bilateral or unilateral characteristics. The following table
lists the possible chart types. Consult the relevant paragraph for the formulas used to
calculate the control limits.
Chart name Dispersion index
Forming the samples
and notes
Standard XR chart
(Shewhart XR chart)
Range
A consecutive number of
measurements between
2 and 15
Standard XS chart
(Shewhart XS chart)
Sigma
A consecutive number of
measurements between
2 and 15
The XR and XS charts are based on a series of values known as Control Limits that are
used to control the process trend; these limits can be calculated beforehand, based on
the characteristic specification limits.
The following formulas are used to calculate them: the values A, D1, D2, E7, E6, B5 and B6
indicate the values in the columns of the same name in the tables found in the appendix, in
the row corresponding to number of measurements in the sample used.
Vn is the bilateral characteristic tolerance mid-point; whereas, if the variable is unilateral, it
is assumed that Vn=0 and one of the two limits is null.
Cpo is the optimum capacity index to be achieved for the process. At the moment this is
equivalent to 1 in the case of bilateral characteristics, and 1.33 for unilateral characteristics.
Pre-set control limits for the X chart
LCL = Vn – (A x (UTL-LTL))/ (6*Cpo))
UCL = Vn + (A x (UTL-LTL))/ (6*Cpo))
Pre-set control limits for the R chart
LCL = D1 x (UTL-LTL)/ (6*Cpo)
UCL = D2 x (UTL-LTL)/ (6*Cpo)
Pre-set control limits for the R chart
LCL = B5 x (UTL-LTL)/(6*Cpo)
UCL = B6 x (UTL-LTL)/(6*Cpo)
Unilateral or single limit characteristic:
upper limit only; Cpk = (2*(TL – X)) / (6*σ)
lower limit only Cpk =(2*(X – TL)) / (6*σ)
Where:
TL = Tolerance limit <> 0
X = mean measurement value
σ= estimated deviation of the measurements
^
^
^