- 54 -
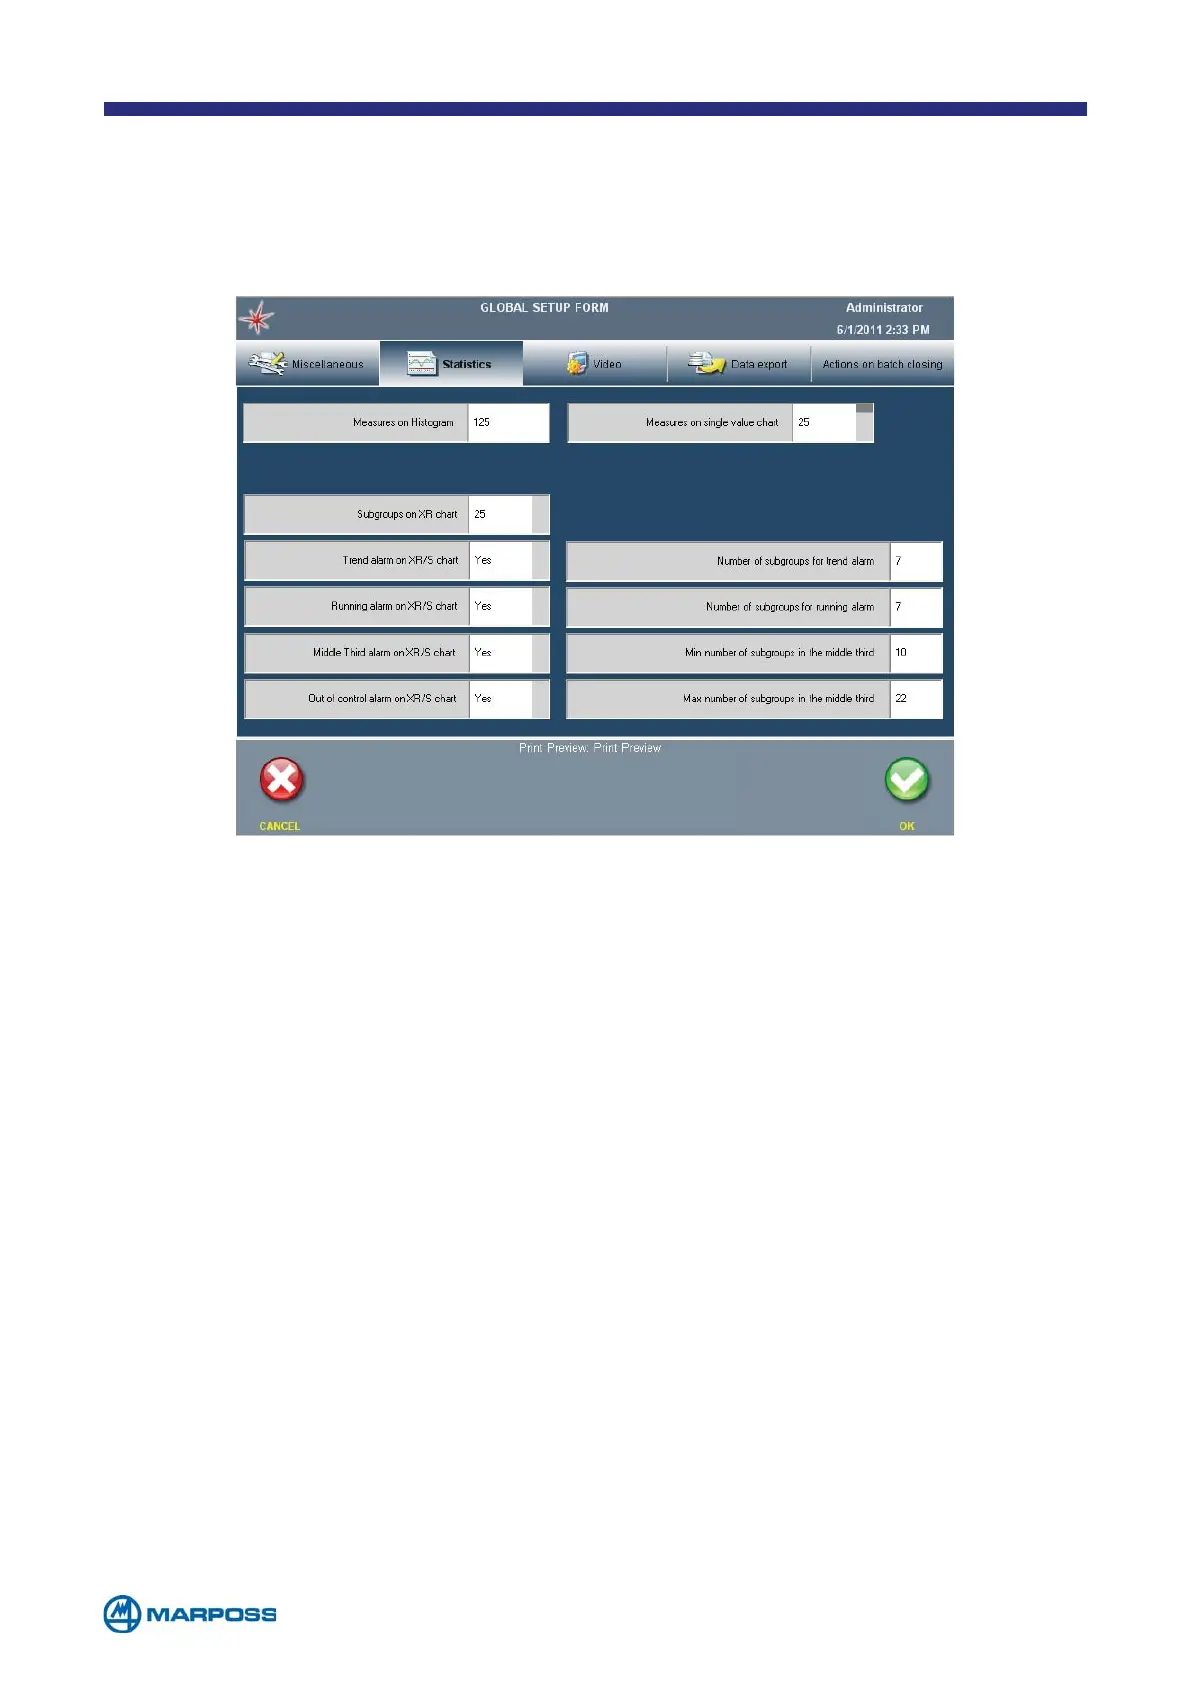
6.4 Statistics TAB
• MEASURES ON HISTOGRAM: maximum number of measurements to be used when
calculating the histogram; maximum value allowed: 1000. This value will be ignored if
the control chart is enabled, and the maximum number of measurements is the same as
required to compile the X/R chart (number of chart subgroups x subgroup dimension).
• M
EASURES ON SINGLE VALUE CHART: number of measurements used to compile
the single values chart. Possible values: none (chart disabled), 25, 50, 75, 100.
• S
UBGROUPS ON X/R CHART: number of samples used to compile the X/R
chart; possible values : 25, 30, 50.
• M
IDDLE THIRD ALARM ON XR/S CHART: it enables the alarm that analyses the “middle third” of
the samples; when this function is enabled, two additional fields are displayed which permit
the operator to define the minimum and maximum values used when calculating this alarm.
• R
UNNING ALARM ON XR/S CHART: it enables the alarm which analyses the samples
“running”; when this function is enabled, an additional field is displayed whichpermits
the operator to define the number of samples used to calculate this alarm.
• T
REND ALARM ON XR/S CHART: it enables the alarm which analyses the samples
“trend”; when this function is enabled an additional field is displayed which permits
the operator to define the number of samples used to calculate this alarm.
• O
UT OF CONTROL ALARM ON XR/S CHART: it enables the alarm which indicates when a sample
is outside the chart control limits; when this function is enabled an additional option (“Sample
Correction”) permits the operator to open a window which displays the correction calculations;
these values represent the difference between the mean value of the sample and the mid-point
of the tolerance range for all of the characteristics which have generated an alarm condition.
The statistics tab contains all the options that can be used to set-up the
measurement statistics calculation and handle the alarms. These parameters are
ignored unless the measurements are acquired within a batch.