- 44 -
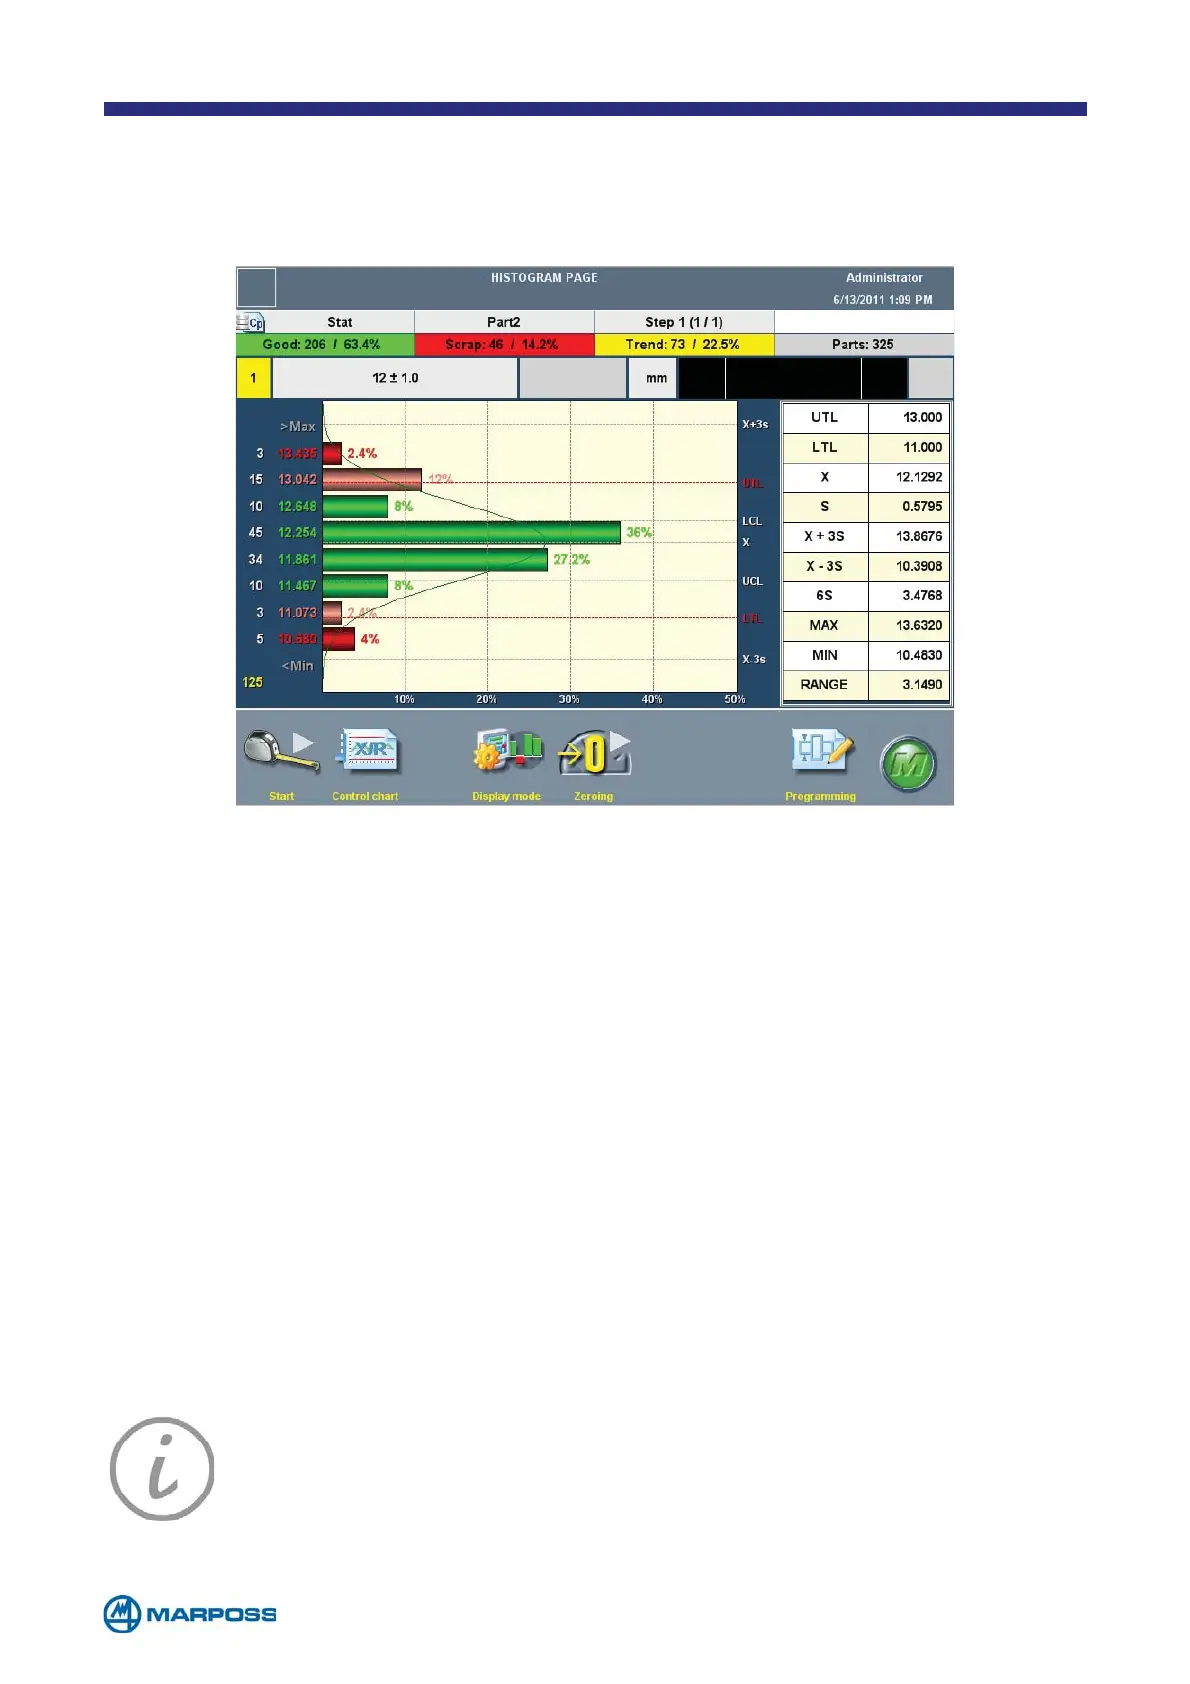
5.1 Histogram
The HISTOGRAM page allows the user to view the HISTOGRAM as well as executing ac-
quisition cycles in the same way as on the M
AIN MEASURE PAGE.
In addition to the measurement bar and the H
ISTOGRAM graph, this page also in-
cludes summary table containing statistical parameters for the data stored in the
current B
ATCH.
The execute measurement S
TEP, delete and modify programming functions are the
same as on the M
AIN MEASURE PAGE.
• tap the C
ONTROL CHART button to display the page containing the BATCH in use.
• tap the T
RACING button to insert the TRACING DATA.
• tap this button to display one or more C
HARACTERISTICS, complete with measu-
rement bar and H
ISTOGRAM, on the same page. When you are using the dual
characteristic configuration, the table containing the statistical evaluations is
automatically hidden in order to simplify the display.
• it enables the O
PERATOR to navigate among the various programmed CHARACTE-
RISTICS.
• Tap P
ROGRAMS to view the PART PROGRAM DEFINITION page and access the programming
phase (see paragraph 3.2.5).
NOTE: Green: Measurement within tolerance
Red: Measurement outside tolerance
Pink: Measurement at tolerance limits
Grey: Invalid measurement