- 48 -
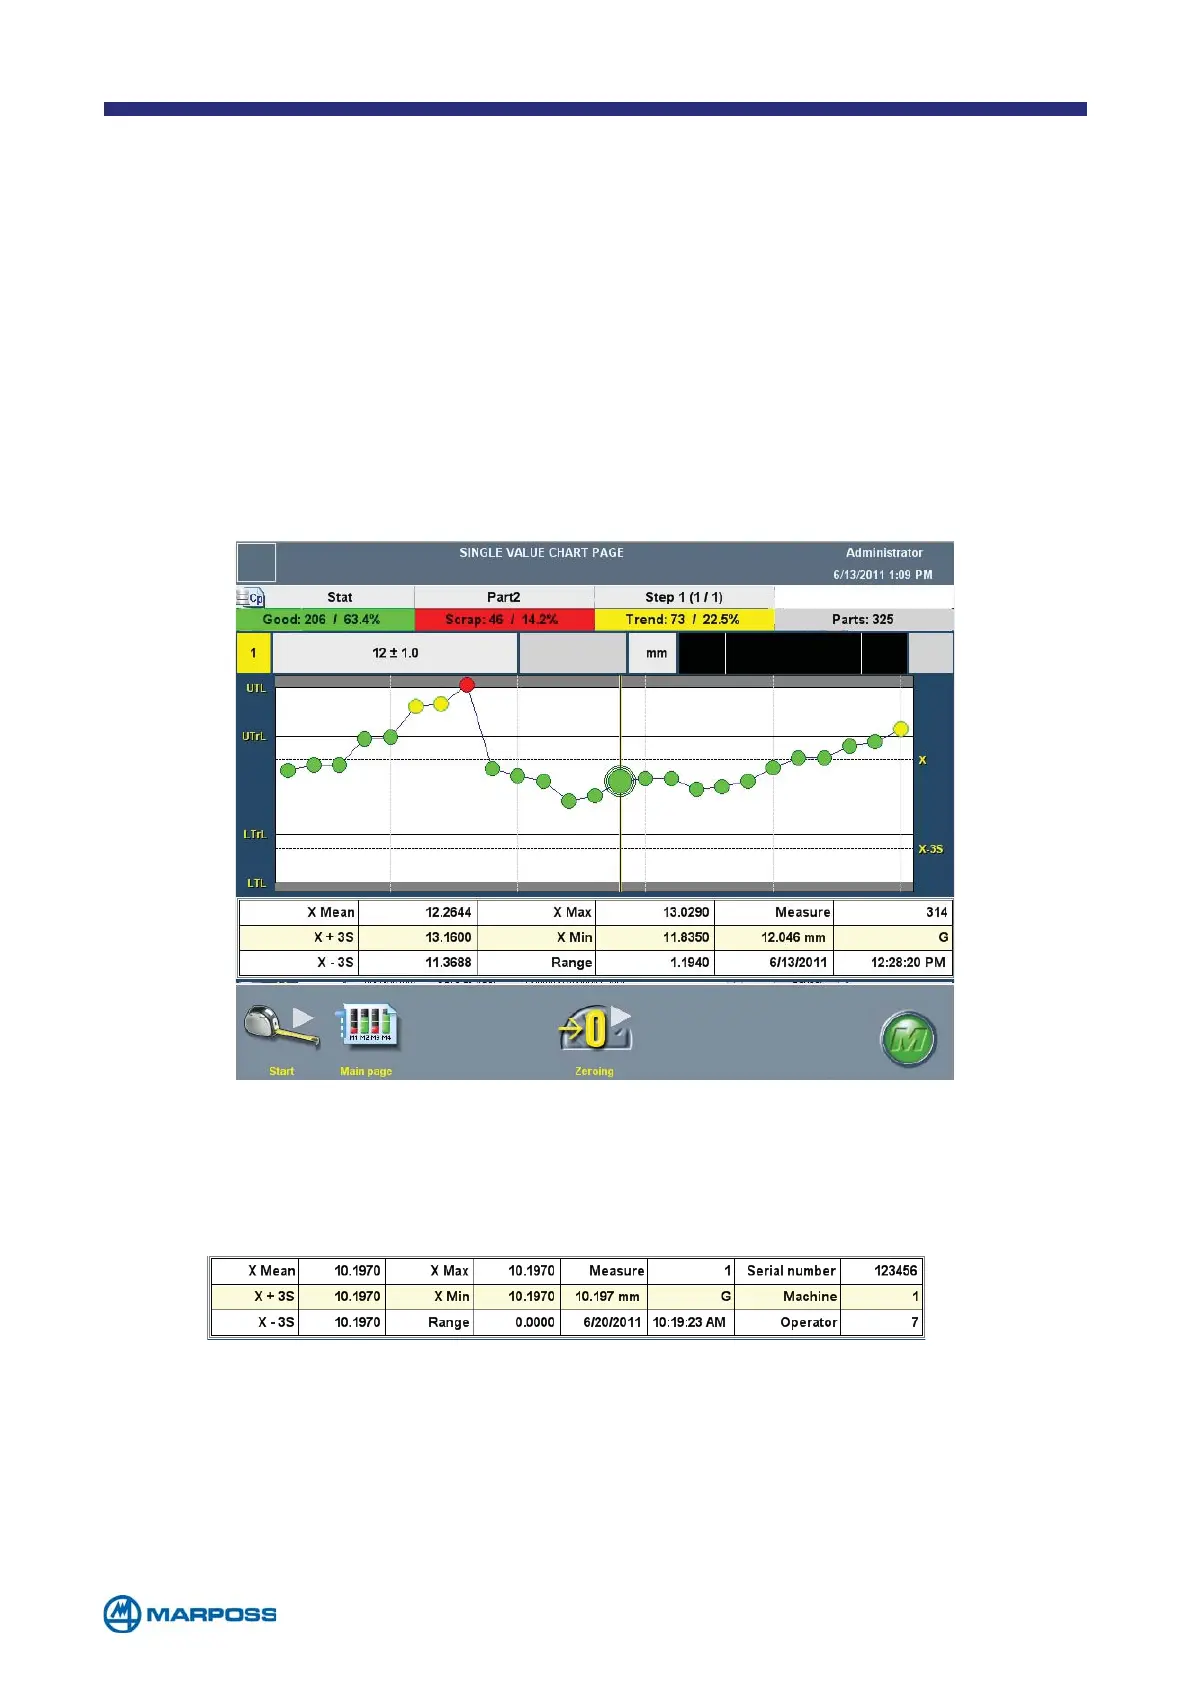
5.3 Single value chart
The SINGLE VALUE CHART PAGE displays information for each single acquisition. This can
be easily done by pointing and tapping directly on the chart; the data are reported
on a grid located underneath the chart itself. This chart must be enabled using the
G
LOBAL SETUP form, defining the number of measurements to be displayed (minimum
25, maximum 100).
If a Batch has been defined for data collection, the information displayed under the
chart includes the first three T
RACING DATA defined for the PART PROGRAM in use. The
values of these data are entered by the T
RACING DATA REQUEST window (see paragraph
4.3).
depending on the measurement results) and the current limits (the limits that are currently
in use). The latter limits can be set-up manually by tapping on the corresponding field.
To select the calculated limits as the current limits, simply tap on the field in the desired
calculated limits column.