- 89 -
Calculated control limits
The XR and XS charts are based on a series of values known as Control Limits that
are used to control the process trend; these limits can be calculated by using the
appropriate sample measurement formulas (if possible, after having completed a
chart consisting of 25 samples, with no out of control alarms).
In the following formulas, the values A, D1, D2, E7, E6, B5 and B6 indicate the values
in the columns of the same name in the tables found in the appendix, in the row
corresponding to number of measurements in the sample used. The value Xm
indicates the mean sample value, and Sm indicates the mean sigma value of the
samples.
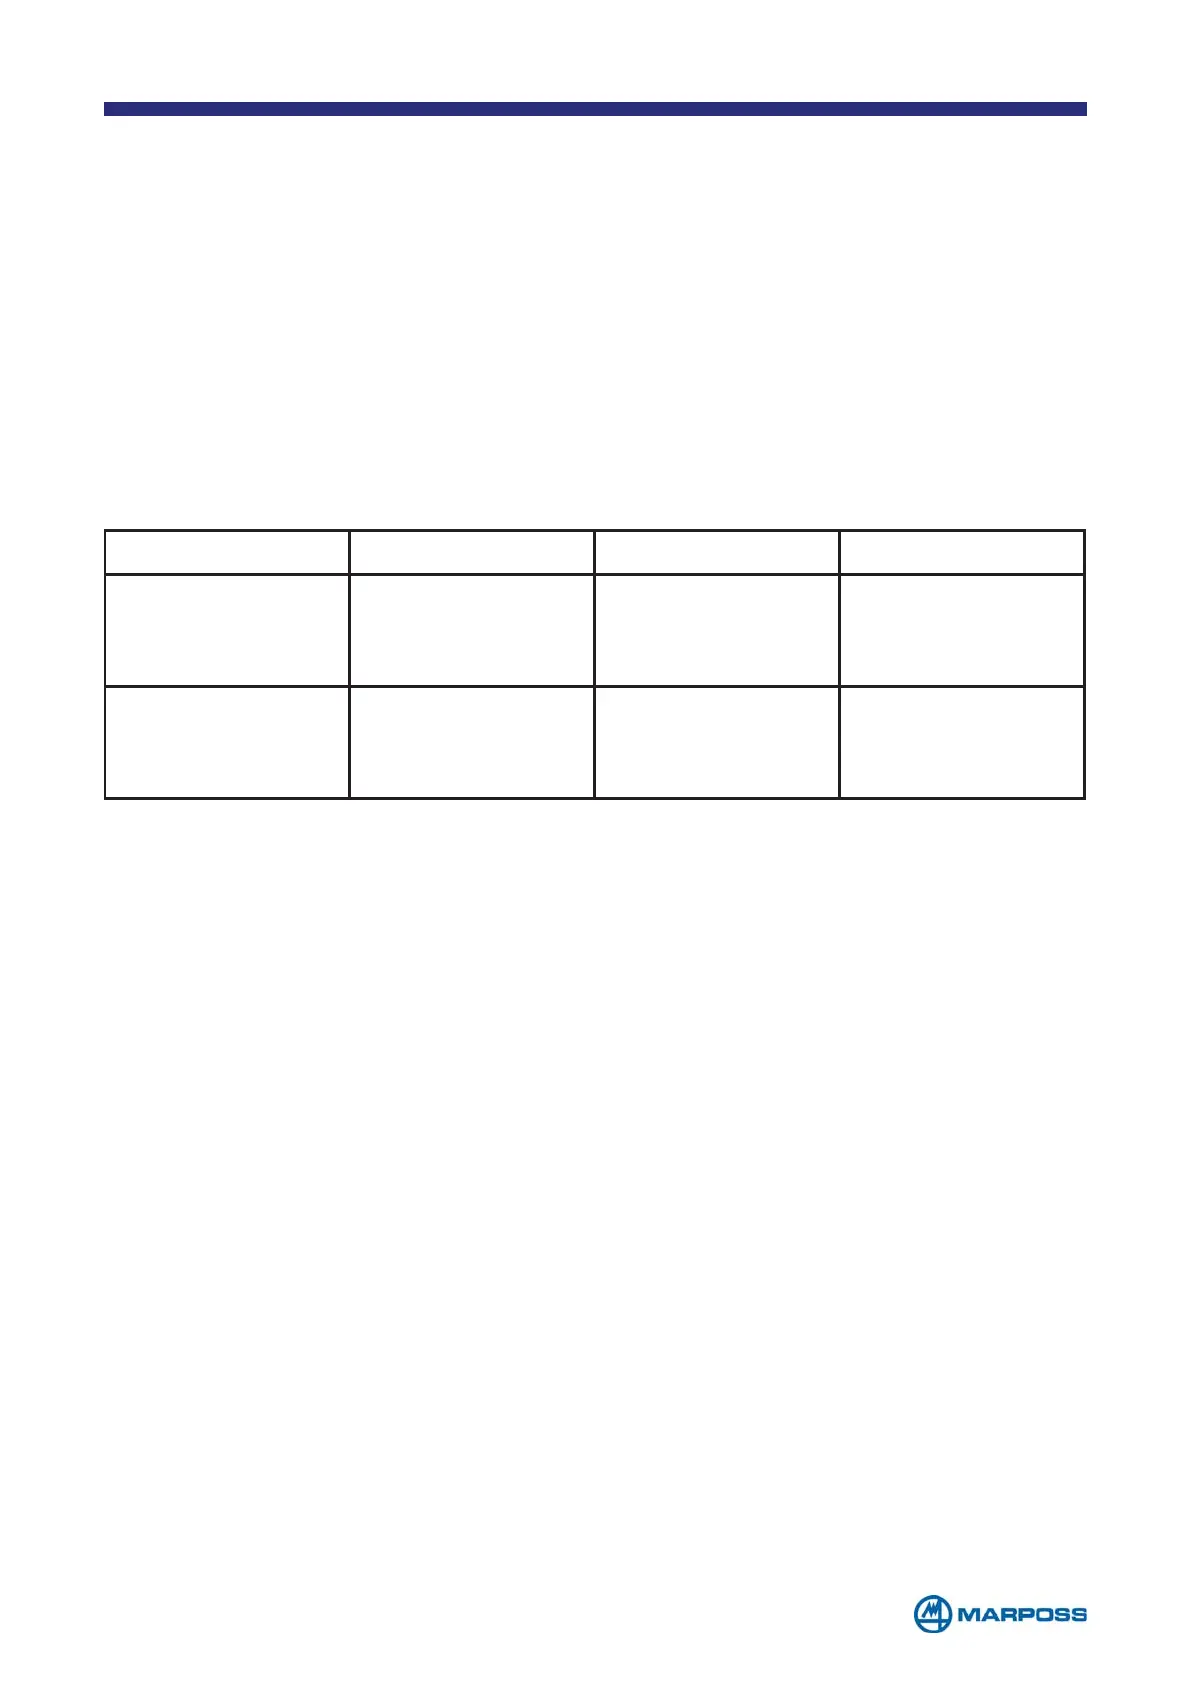
Chart name X CHART R CHART S CHART
Standard XR chart
(Shewhart XR
chart)
LCL: Xm – Rm*A2
UCL: Xm+Rm*A2
LCL:Rm*D3
UCL:Rm*D4
-
Standard XS chart
(Shewhart XS
chart)
LCL: Xm – Sm*A3
UCL:Xm+ Sm*A3
-
LCL:Sm*B3
UCL:Sm*B4