PRELIMINARY
miniDSP Ltd, Hong Kong / www.minidsp.com / Features and specifications subject to change without prior notice 41
7 DIRAC LIVE FILTER DESIGN AND DOWNLOAD
Once the full set of measurements has successfully been taken, DLCT has the acoustical information it needs
about your loudspeakers and listening room to create the correction filters.
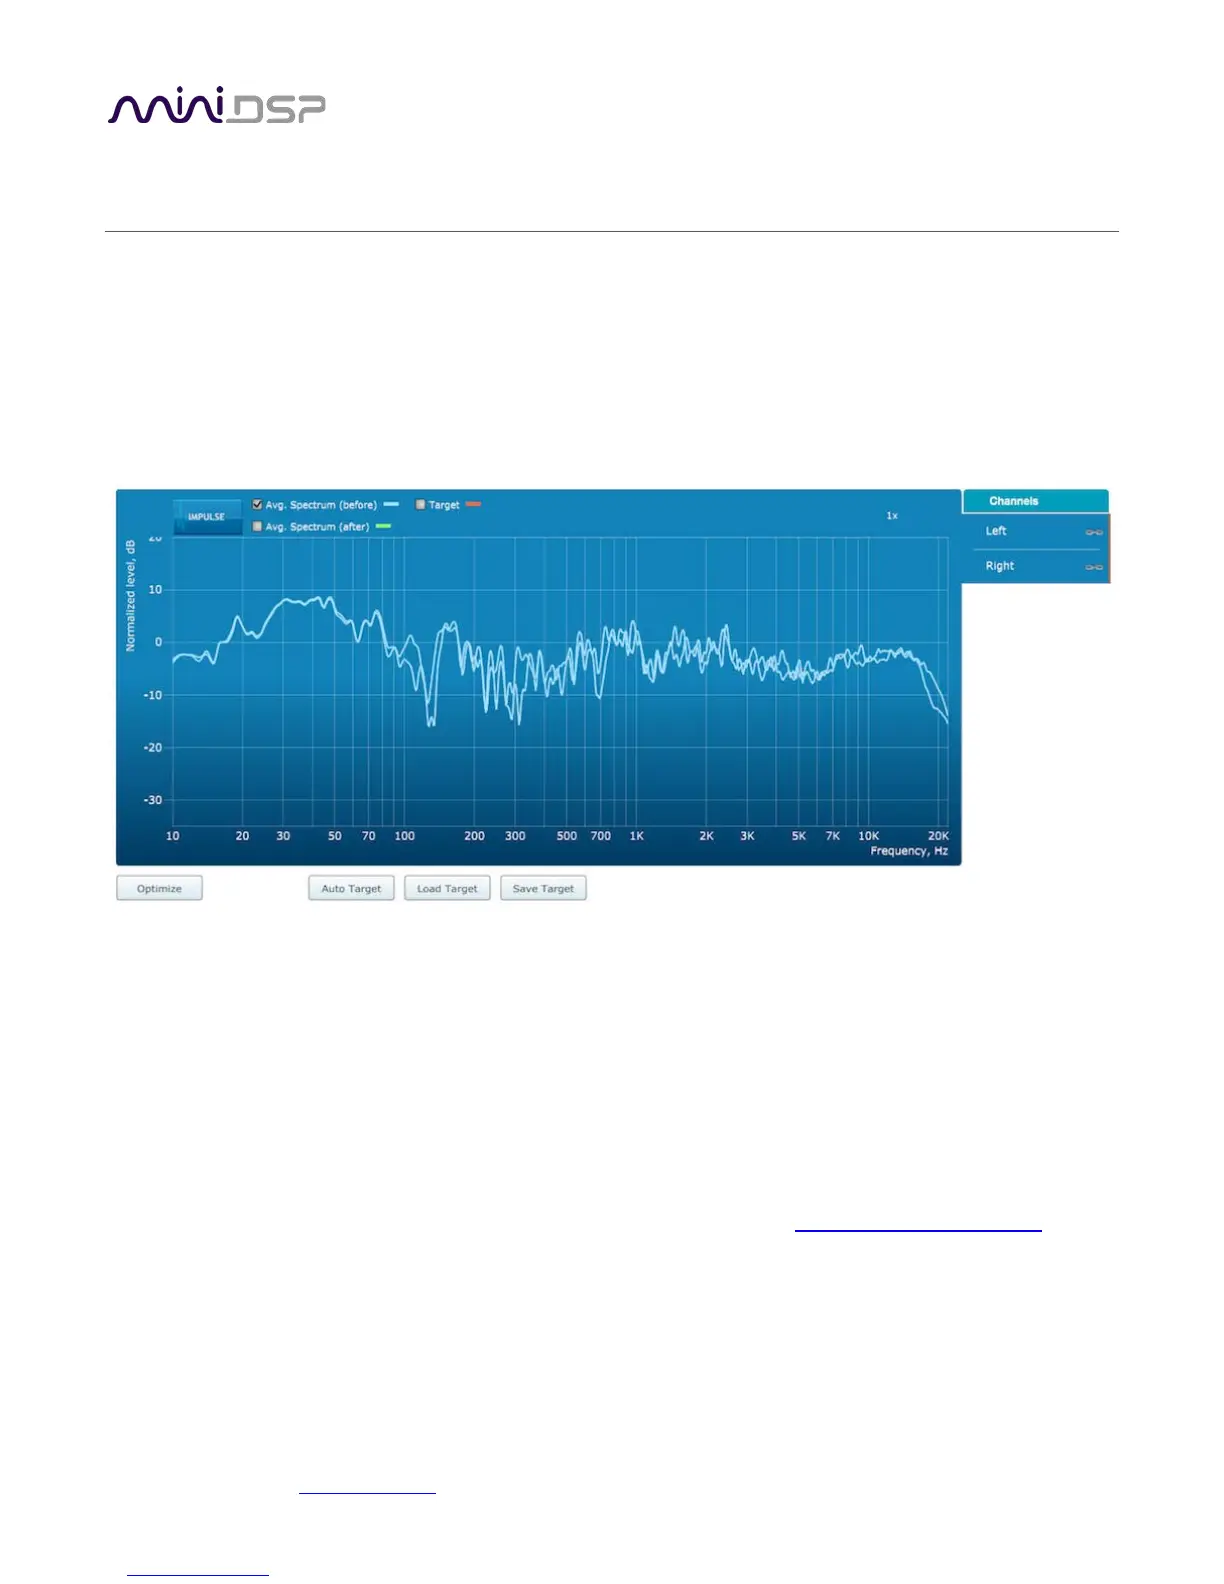
7.1 WORKING WITH GRAPHS
The Filter Design tab shows a number of plots that can individually be turned on and off with the checkboxes
near the top.
Avg. spectrum (before)
The average of the measured magnitude responses. These plots are shown in light blue.
Avg. spectrum (after)
The predicted average magnitude response after correction. These plots are shown in green and can only
be viewed after filters have been generated with the Optimize button.
Target
The target curve – that is, the desired in-room magnitude response. This curve is user-adjustable, so you
can fine-tune it to best suit your speakers, room, and preferences. See Designing your target curve
.