Chapter Six: Embedded Web-Based GUI and Diagnostics Monitor Mode
56
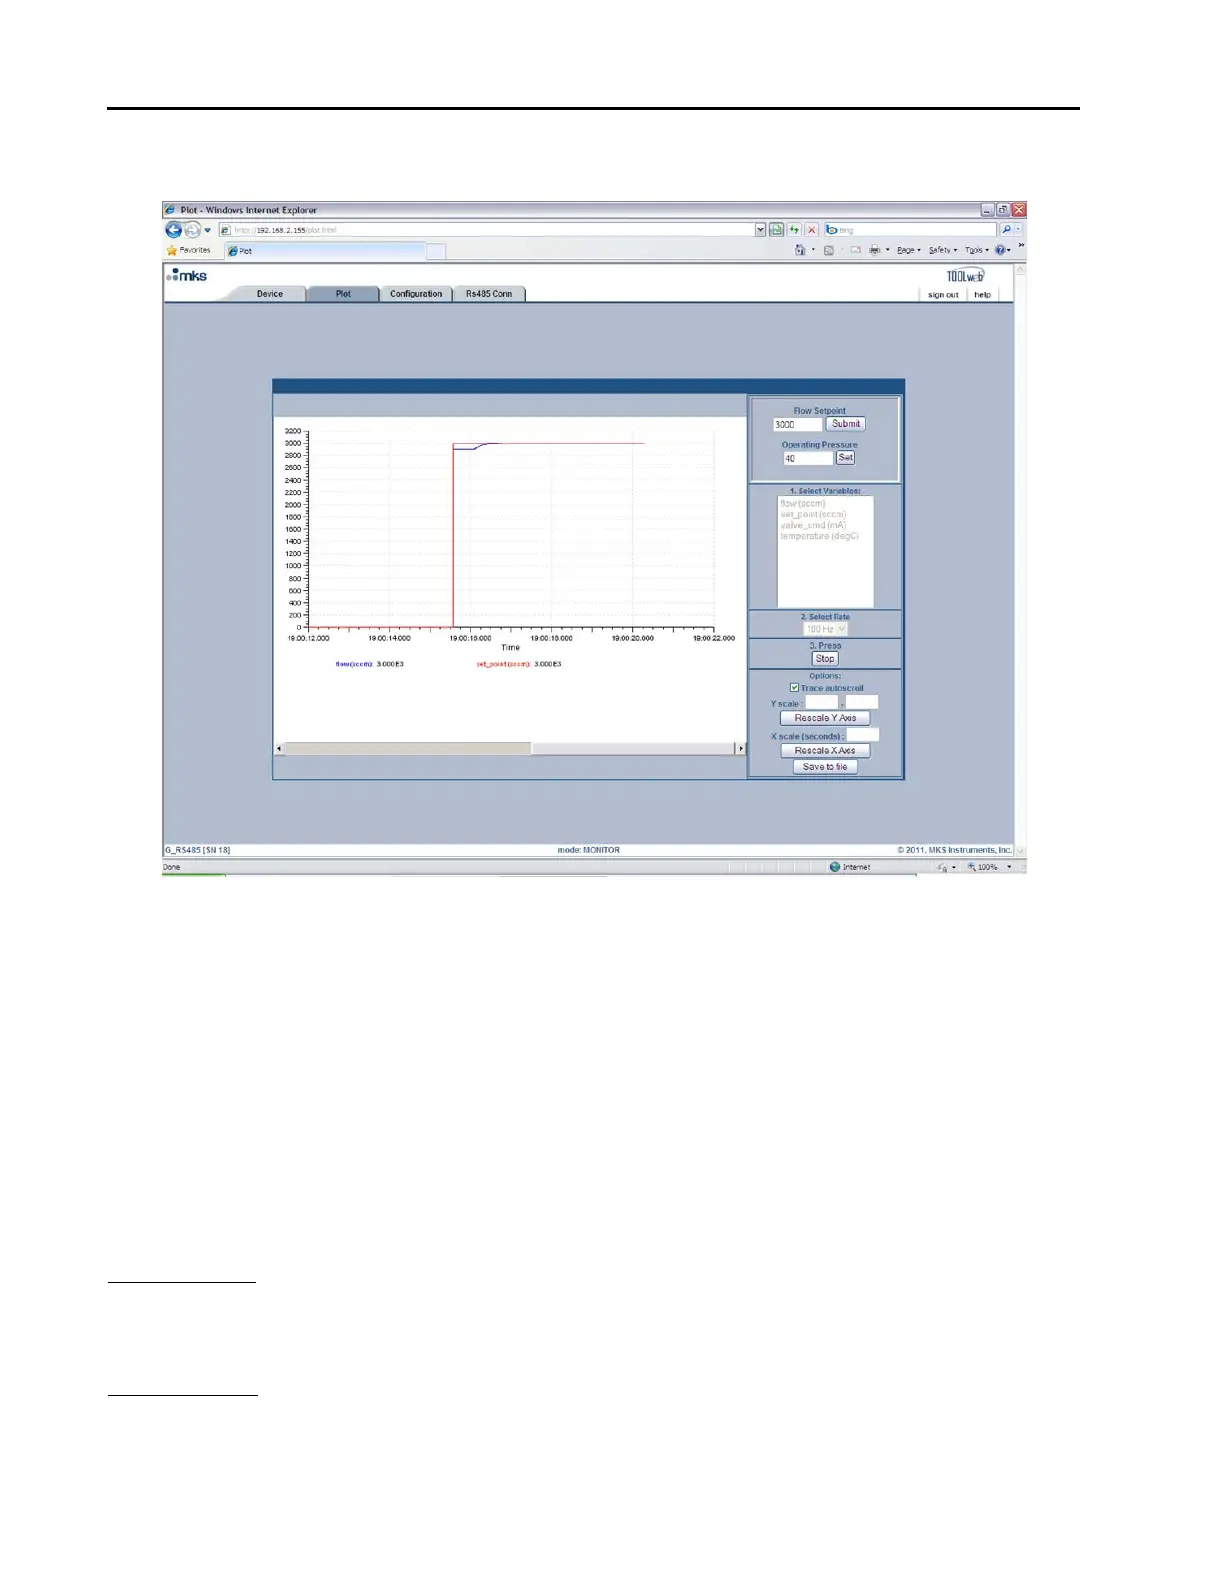
Figure 10: Embedded GUI, Plot Page in Monitor Mode
Starting and Stopping the Plot program
Below the Rate selection is the Start/Stop button for the plot program. You must click on this button to start
the plot program and click on it a second time to stop the program.
Options (Trace Autoscroll, Rescaling Y Axis, Rescaling X Axis, Save to File)
Below the Start/Stop button, you should see the Options section. Here you are able to start/stop the
autoscrolling feature, rescale the Y-Axis, rescale the X-Axis or save the plot data to a file. These options are
described in detail below:
Trace Autoscroll unchecking this checkbox will stop the plot program from scrolling in the X-direction.
This option only has an effect while the program is running. Rechecking this checkbox
will enable the plot program to resume scrolling. The X-Axis scroll bar may be used for
manual scrolling.
Rescaling Y-Axis next to where it says “Y scale:” enter in the scale (Min) to (Max), and then click on the
“Rescale Y-Axis” button. This option only has an effect if the “Trace Autoscroll”
checkbox is unchecked or the plot program is stopped. Otherwise the Y-Axis will
automatically scale itself to fit all variables being plotted.