Monitor Mode Chapter Six: Embedded Web-Based GUI and Diagnostics
55
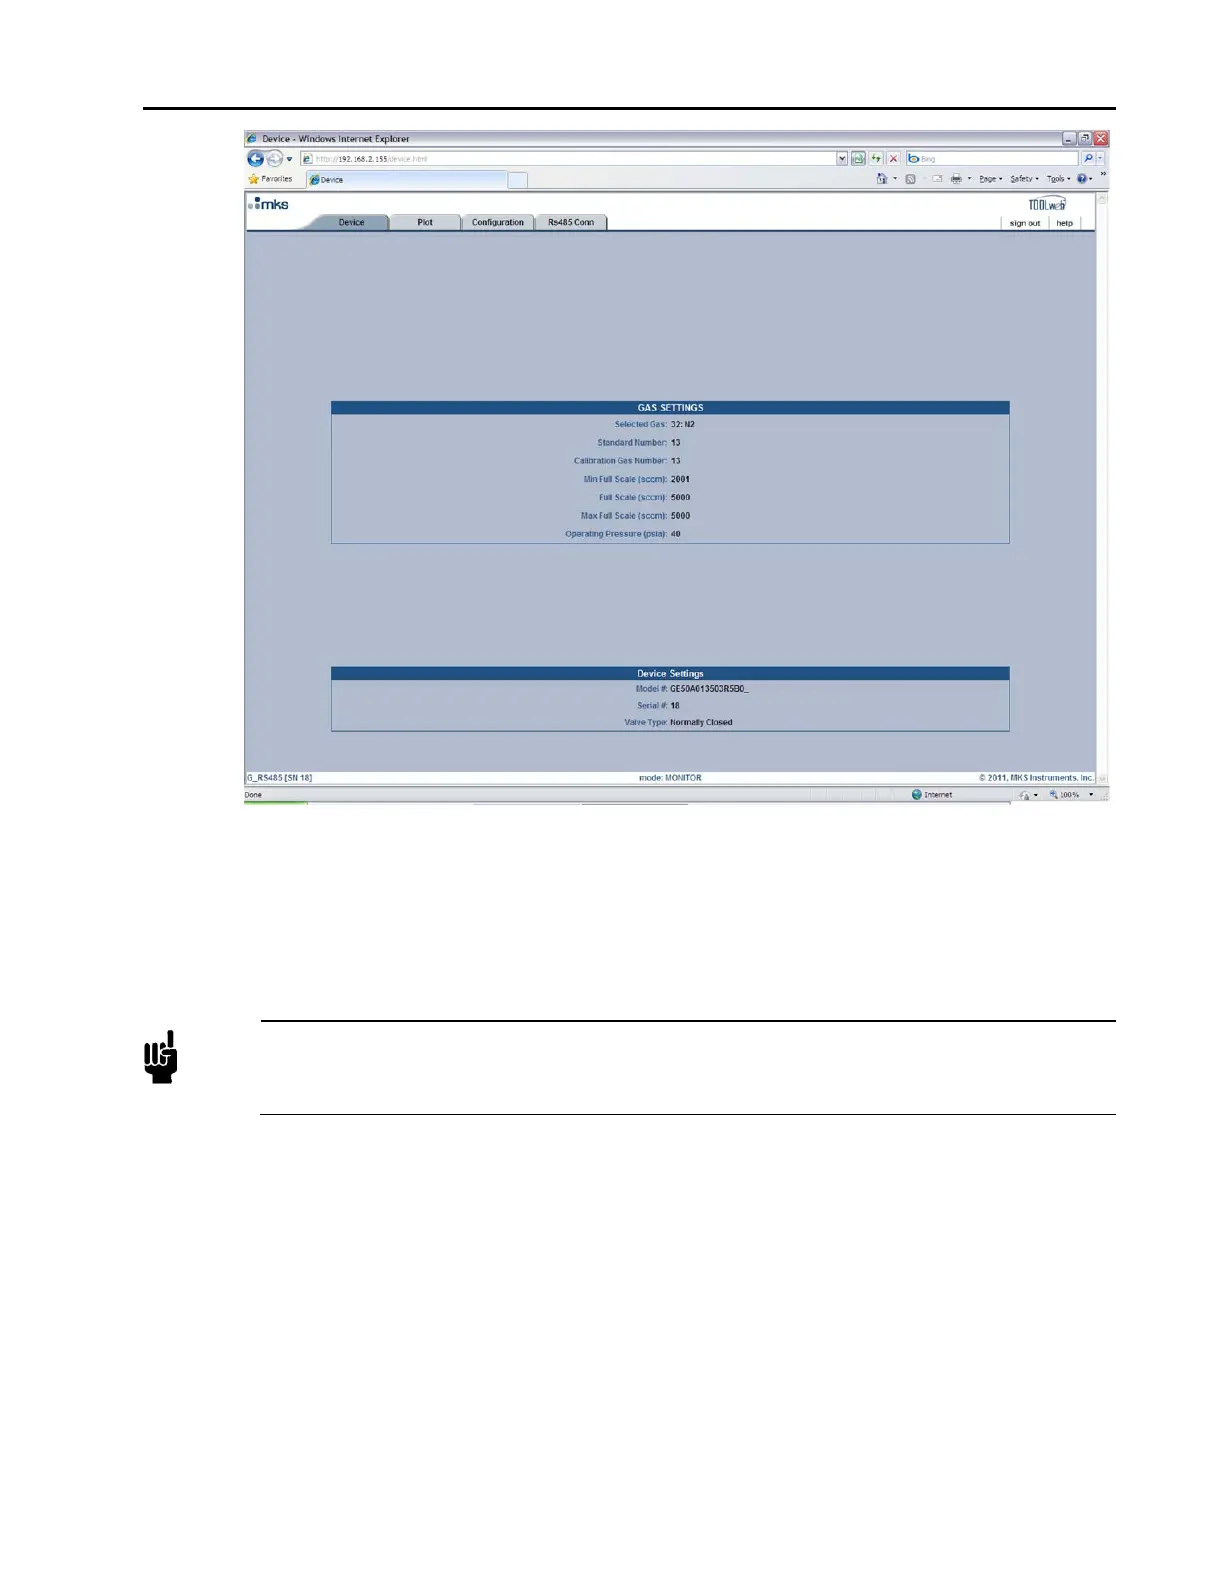
Figure 9: Embedded GUI, MFC Device Page in Monitor Mode
Plot Page – Monitor Mode
This page, shown in Figure 10, enables you to plot and see real-time performance of the device. In Monitor
Mode you are able to select variables to plot, the rate at which to display them, and save the data that has been
plotted.
Note
The Plot Page requires a java applet to use the plot program. This applet, which must be installed
on the computer trying to view the page, can be downloaded by following the instructions listed
on page 44.Step 1: Install the Java™ Plug-In
Selecting Variables To Plot
On the right-hand side of the Plot page you should see the Variables section. Here you have the ability to
select one or more variables to plot.
o To plot one variable: click on the variable you wish to plot.
o To plot two or more variables: either select the variables one-by-one while holding your keyboard’s
control “Ctrl” key down or select all the variables by selecting the first variable in the list and then
selecting the last variable listed while holding your keyboard’s “Shift” key down.
Selecting Rate
Directly below the list of variables is the Rate selection drop down menu. Here you are able to select the
sampling rate at which you’d like to plot the variables. Available rates are 1, 2, 5, 10, 50 and 100 Hz.