153
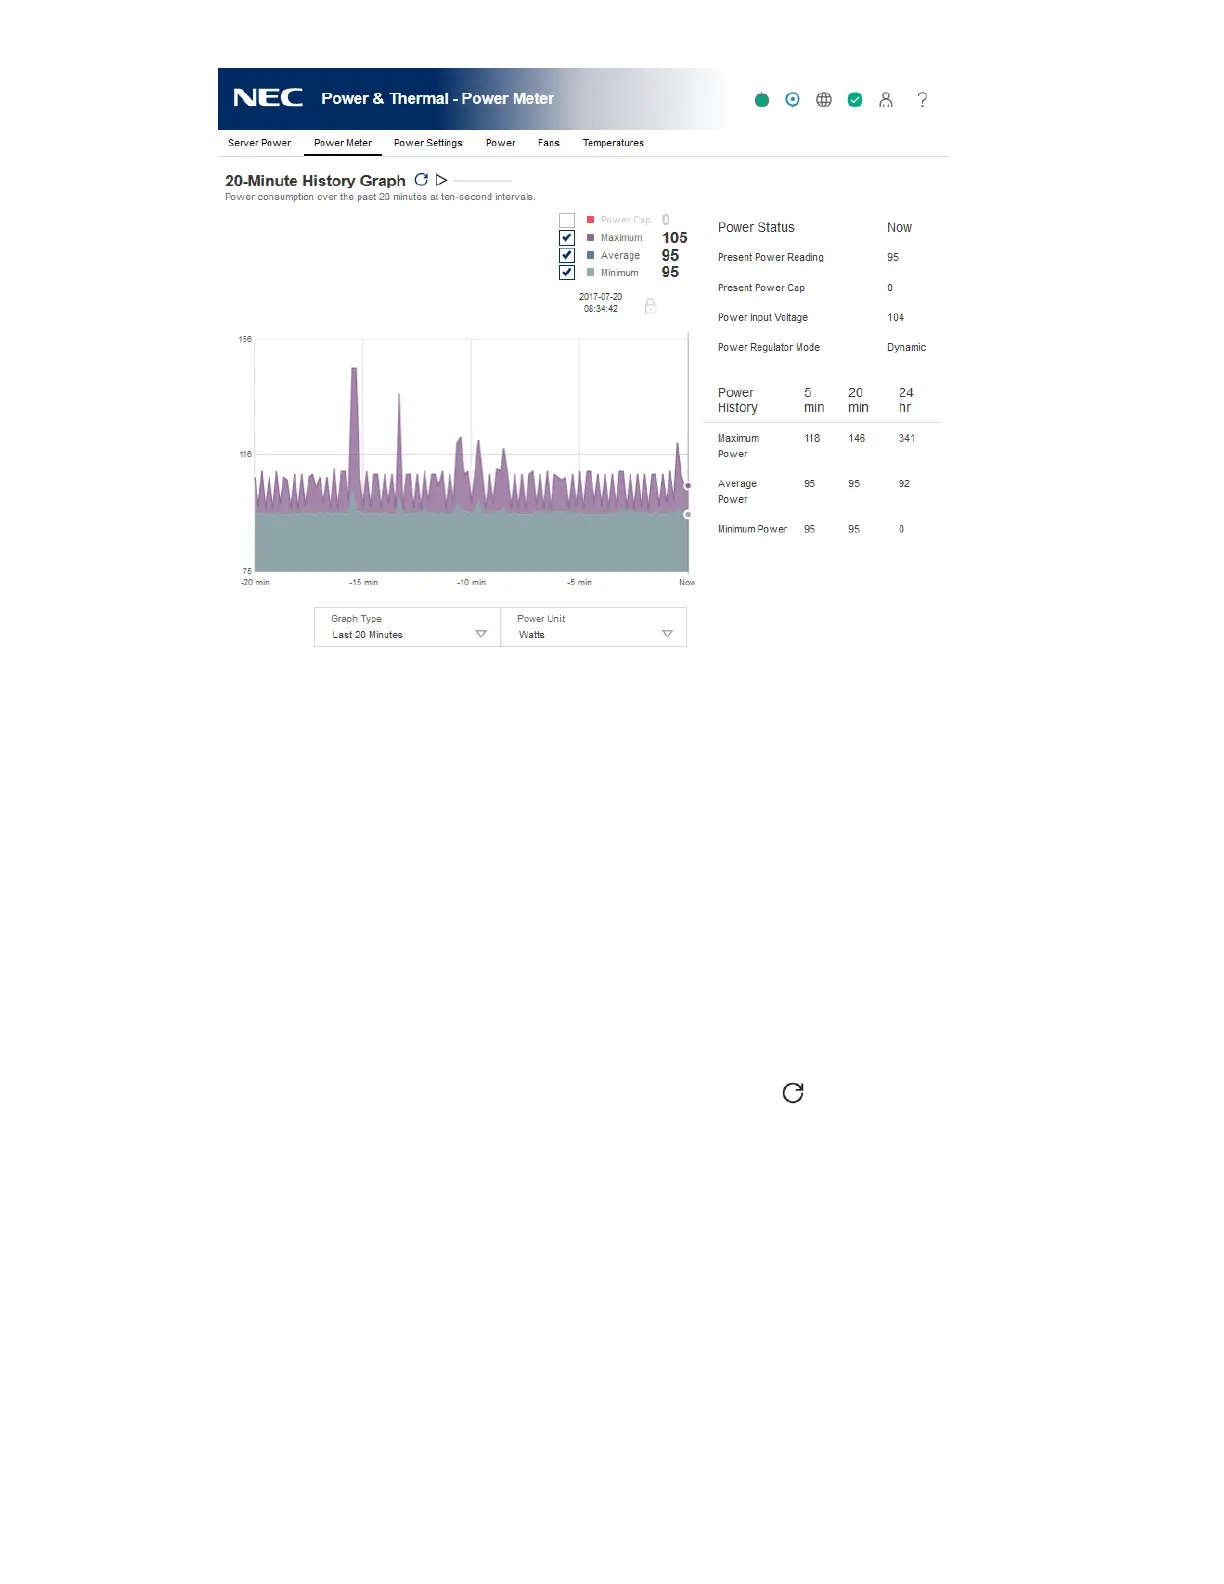
2. Select a graph type in the Graph Type menu.
You can view a graph of the last 20 minutes or the last 24 hours.
To view data for the measured values, move the cursor from side to side within the graph.
3. Optional: To customize the graph display, select or clear the following check boxes:
• Power Cap
• Maximum
• Average
• Minimum
4. Optional: Choose how to refresh data on this page.
By default, the page data is not refreshed after you open the page.
• To refresh the page immediately, click the refresh icon .
• To start refreshing the page automatically, click the triangle icon next to the refresh icon.
Depending on the selected graph type, the page refreshes at ten-second or five minute
intervals until you click the stop icon or navigate to another page.
5. Optional: To change the power reading display to watts or BTU/hr, select a value from the
Power Unit menu.
6. Optional: To lock the displayed data at a specific point on the graph, move the cursor to the
desired point, and then click.
To unlock the cursor, click in the graph again or click the lock icon.