167
Temperature information
The Temperature Information page includes a temperature graph and a table that displays the
location, status, temperature, and threshold settings of temperature sensors in the server chassis.
If the server is powered off, the system health information on this page is current as of the last
power off. Health information is updated only when the server is powered on and POST is
complete.
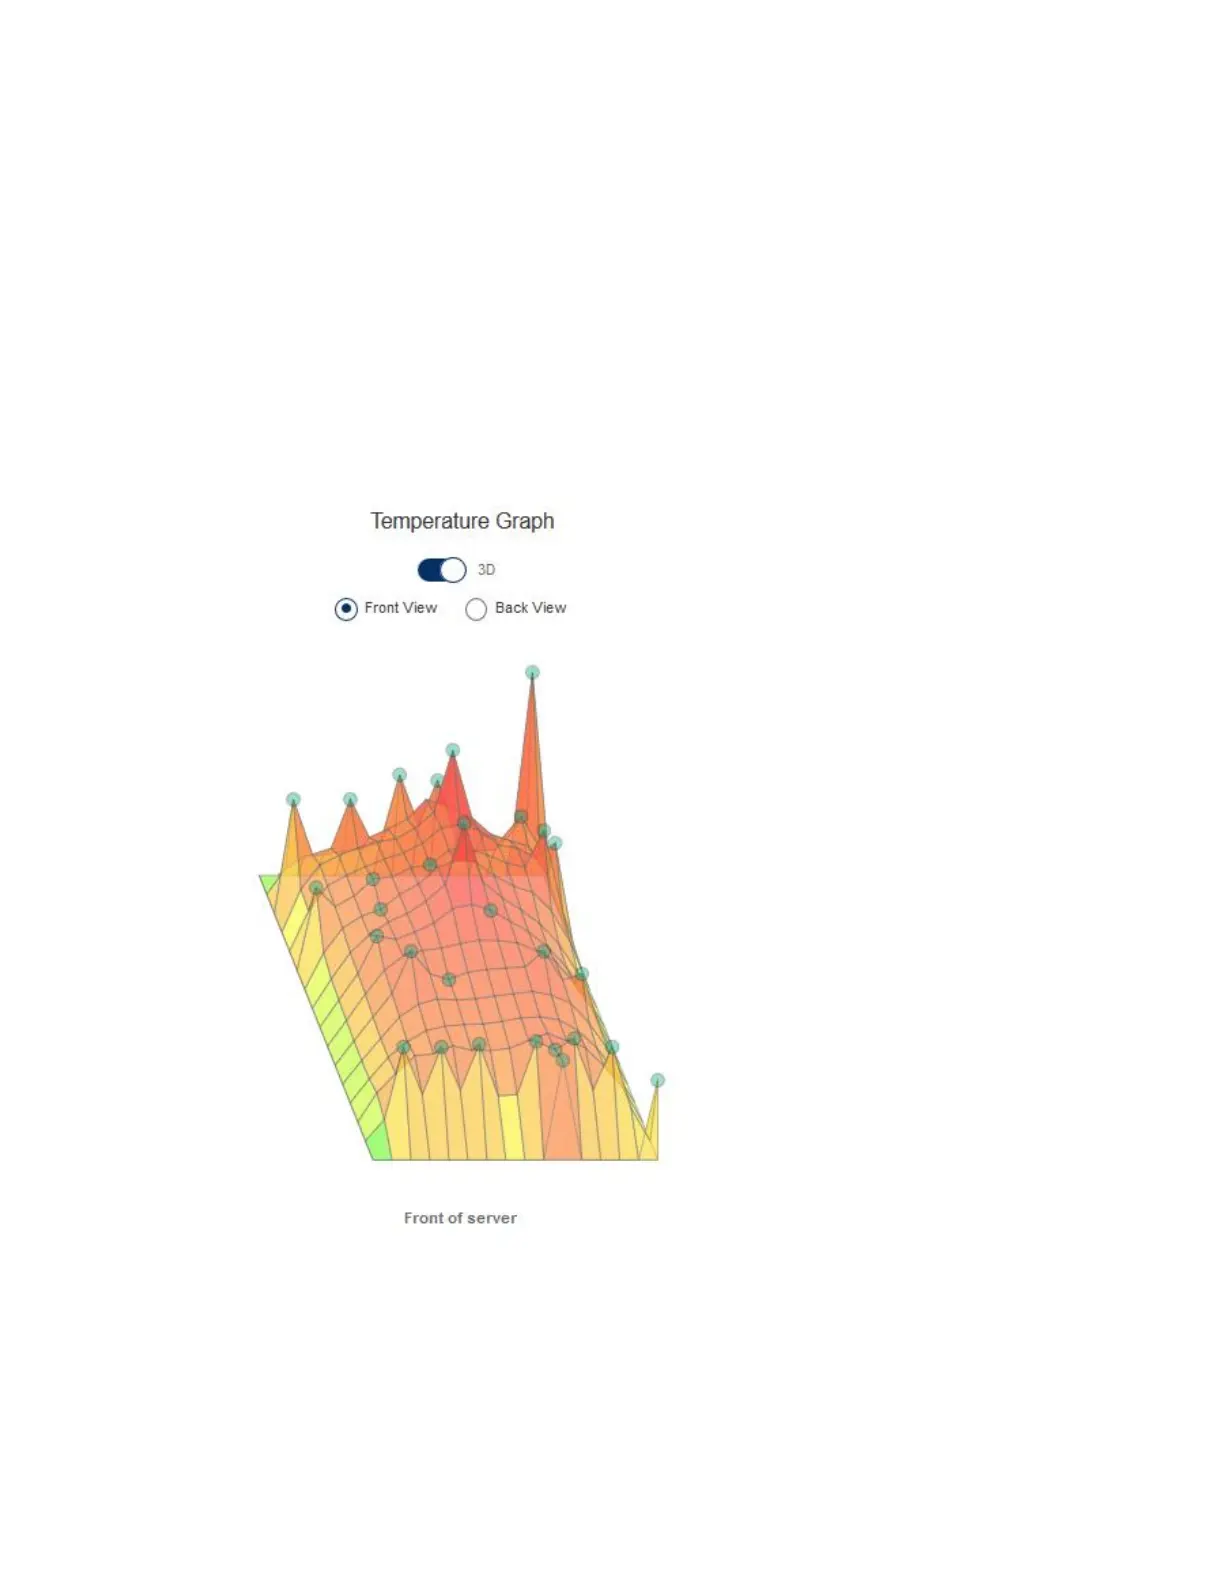
Viewing the temperature graph
Procedure
1. Click Power & Thermal in the navigation tree, and then click the Temperatures tab.
2. Optional: Customize the graph display.
• To display a three-dimensional graph, select the 3D check box.
• To display a two-dimensional graph, clear the 3D check box.
• To display the sensors at the front or back of the server, select Front View or Back View.
3. Optional: To view individual sensor details, move the mouse over a circle on the graph. The
sensor ID, status, and temperature reading are displayed.