168
Temperature graph details
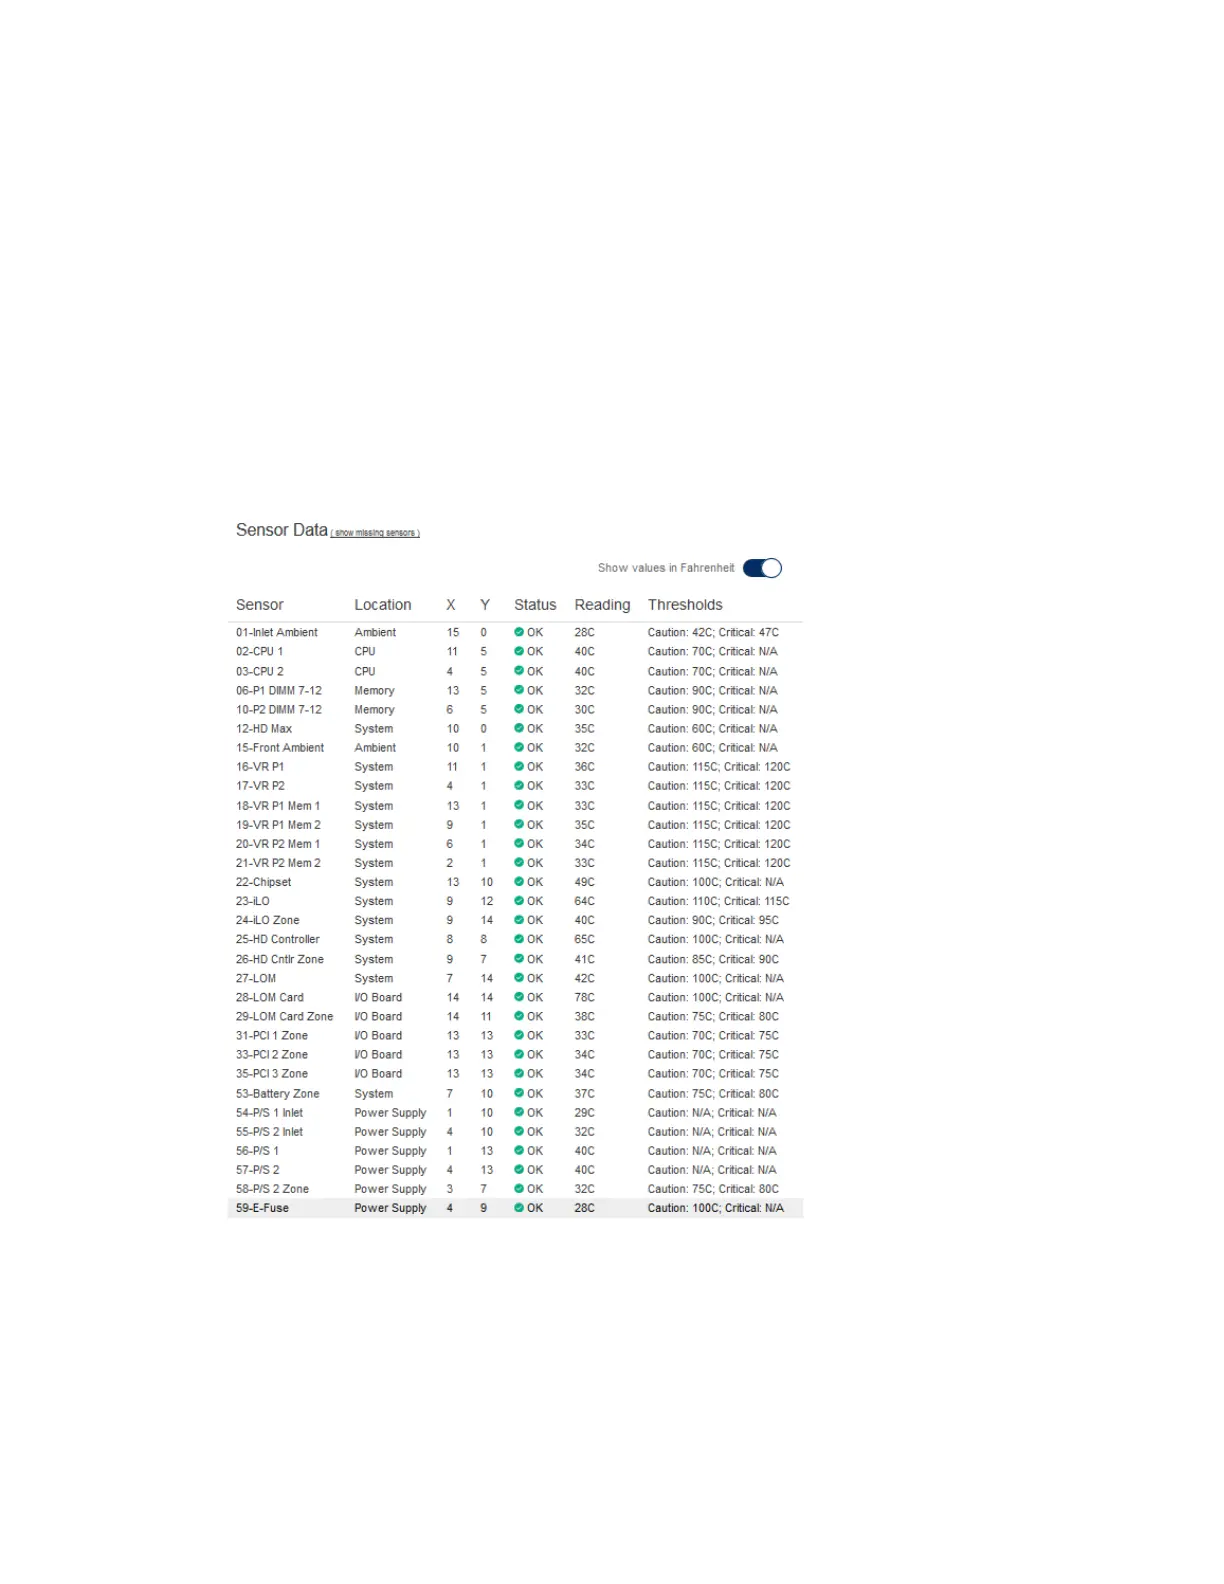
When you view the temperature graph, the circles on the graph correspond to the sensors listed
in the Sensor Data table.
The color on the graph is a gradient that ranges from green to red. Green represents a
temperature of 0°C and red represents the critical threshold. As the temperature of a sensor
increases, the graph color changes from green to amber, and then to red if the temperature
approaches the critical threshold.
Viewing temperature sensor data
Procedure
1. Click Power & Thermal in the navigation tree, and then click the Temperatures tab.
2. Optional: When temperatures are displayed in Celsius, click the Show values in Fahrenheit
switch to change the display to Fahrenheit. When temperatures are displayed in Fahrenheit,
click the Show values in Celsius switch to change the display to Celsius.
3. Optional: By default, sensors that are not installed are hidden. To view the missing sensors,
click show missing sensors. When missing sensors are displayed, click hide missing
sensors to hide them.