TARGAS-1 Operation Manual V. 1.02 73 support@ppsystems.com
SRC – Start Measuring Menu
Current CO
2
concentration (ppm).
Countdown in seconds (from 10 to 0)
Stops the SRC process and returns to SRC – Other Settings menu (Step 4).
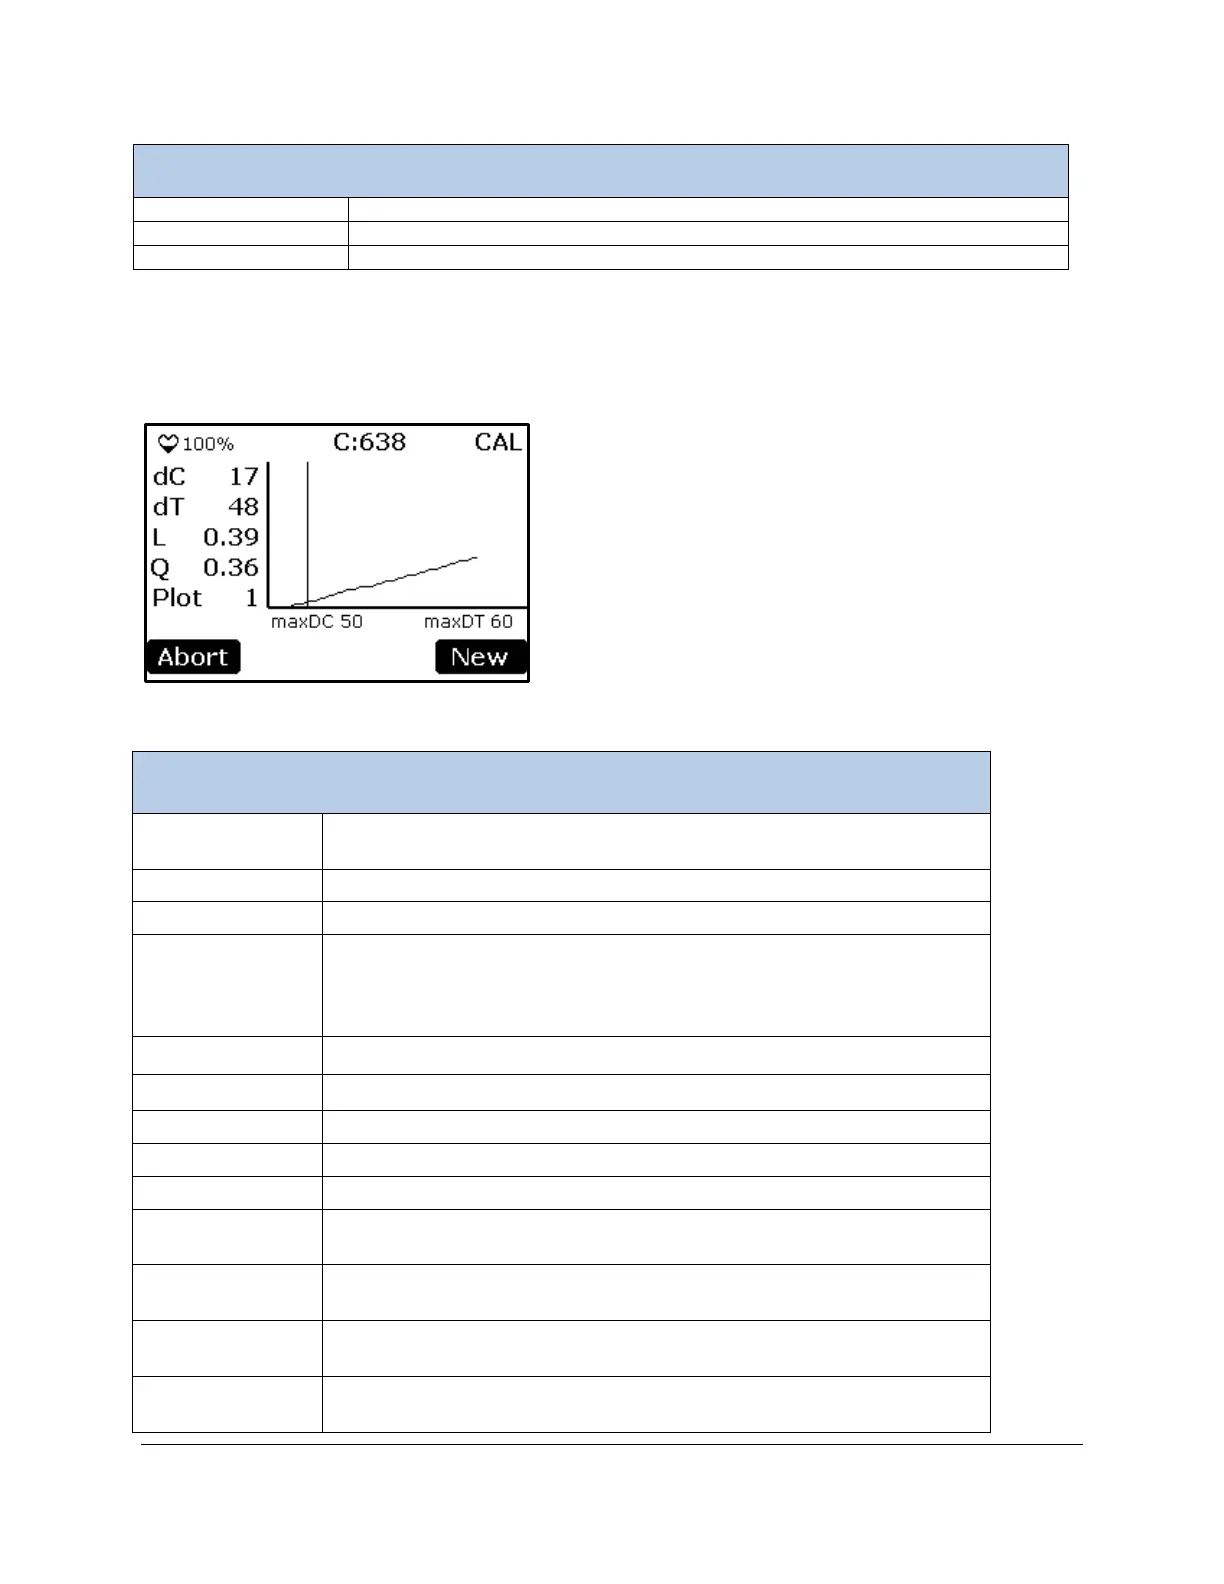
Data Plot Screen (Step 7)
This screen displays present values and a graphical representation of the data gathered during the
current session.
Pulses on and off to indicate that the system is powered and operating.
Press to return to normal 1 second display updates.
Percentage of battery life remaining (%).
Current CO
2
concentration (ppm).
Delay is the countdown in seconds from x to 0, where x is the delay
value specified in SRC – Termination Settings (Step 3). CAL is the active
CO
2
concentration calculating phase. END indicates calculations have
2
concentration (ppm) from time = 0 seconds.
Elapsed time (seconds) for the current session (i.e., change in time).
Linear respiration rate (g m
-2
hr
-1
).
Quadratic respiration rate (g m
-2
hr
-1
).
Plot number defined by user in SRC – Other Settings (Step 4).
Time (0 to maxDT seconds). Vertical line represents start of
calculations.
2
concentration from start of measurement. 0 to
maxDC (ppm)
Maximum positive change in CO
2
concentration (ppm) allowed in a given
session. This value is defined in SRC – Termination Settings (Step 3).
Maximum time for which changes in the chamber CO
2
concentration are
monitored in a given session. This value is defined in SRC – Termination