TARGAS-1 Operation Manual V. 1.02 84 support@ppsystems.com
Stops the CPY process and returns to CPY – Other Settings (Step 4).
At this stage, the CPY chamber should be placed on the soil. The internal fan is set to a low speed to
provide an even concentration of CO
2
. The number at the top right of the screen (7 in this case) is the
countdown. CO
2
concentration is displayed during this step. When completed, CPY Data Plot Screen
(Step 7) will be displayed.
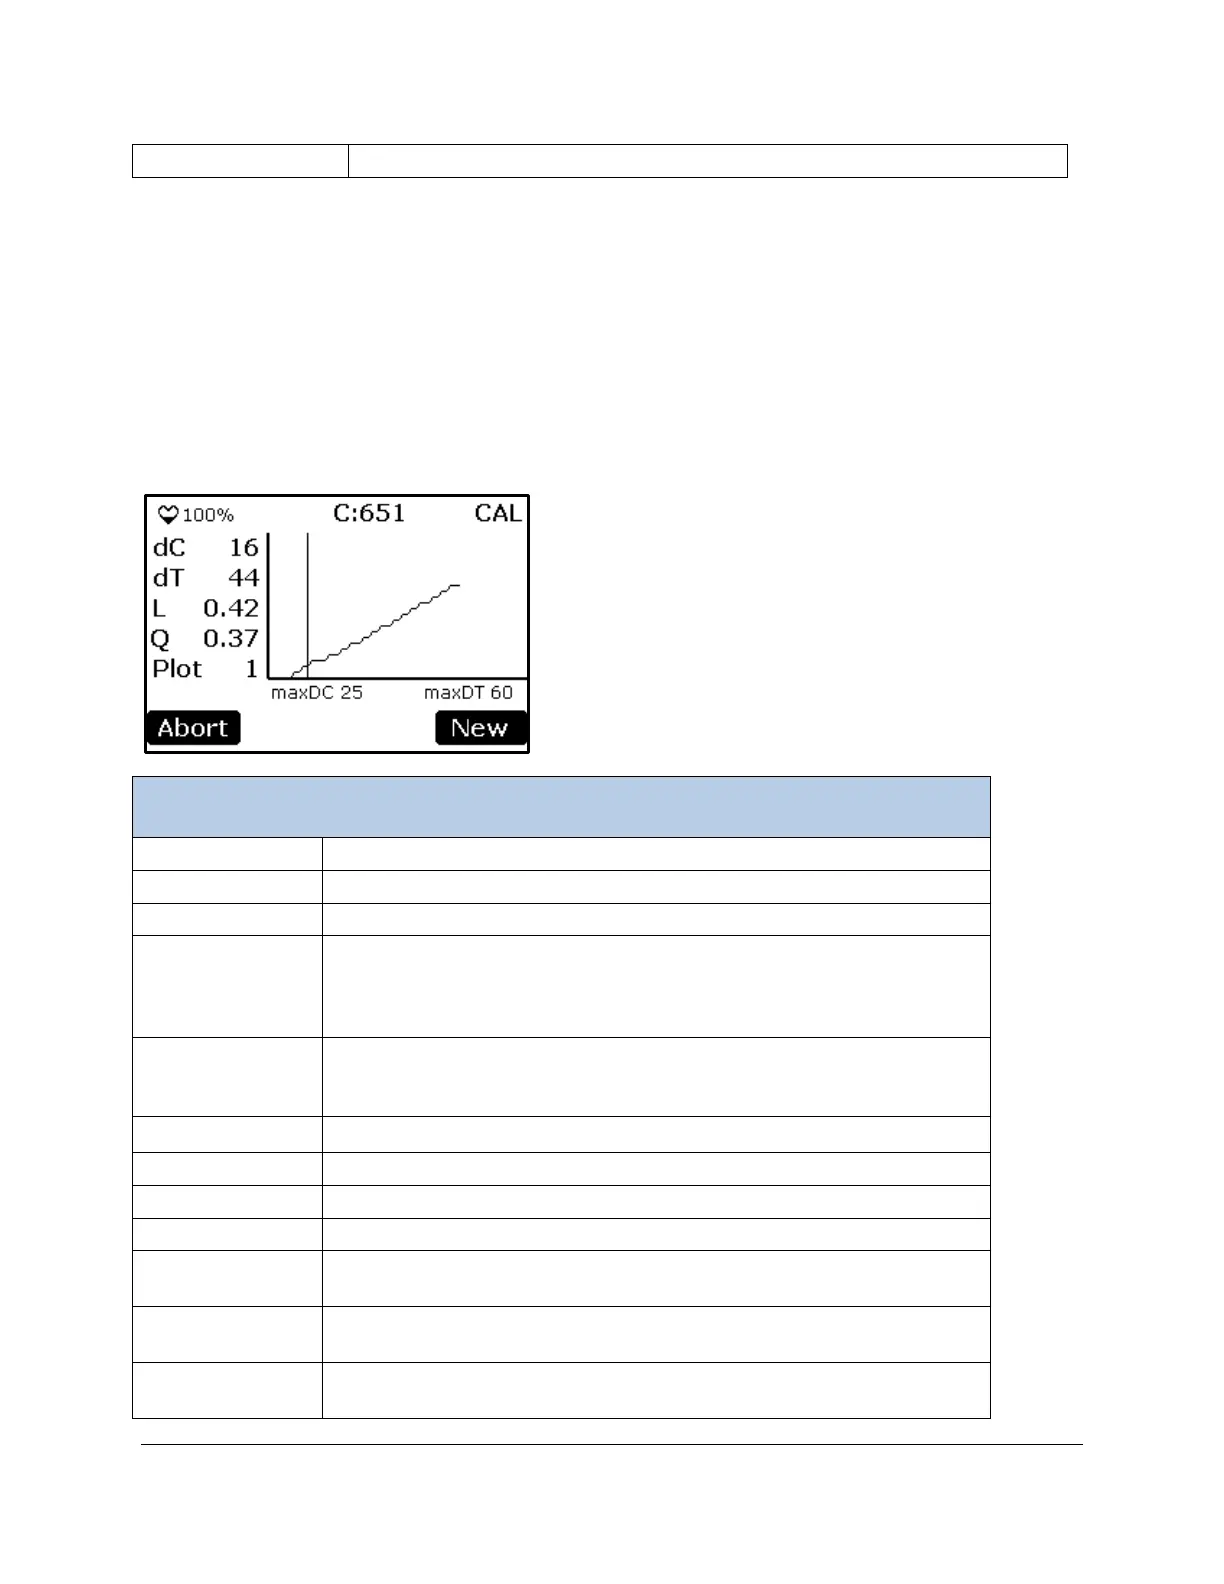
CPY Data Plot Screen (Step 7)
This screen displays present values and a graphical representation of the data gathered during the
current session.
Pulses to indicate that the system is powered on (power status).
Percentage of battery life remaining.
Current measurement of CO
2
Concentration (ppm).
Delay is the countdown in seconds from x to 0, where x is the delay
value specified in CPY – Termination Settings (Step 3). CAL is the active
CO
2
concentration calculating phase. END indicates calculations have
The current difference in CO
2
concentration (ppm) from time = 0
seconds. Normally in assimilation, CO
2
concentration is decreasing, but
for display purposes the negative values are inverted.
Elapsed time (seconds) for the current session (i.e., change in time).
Linear assimilation rate (μmol m
-2
s
-1
).
Quadratic assimilation rate (μmol m
-2
s
-1
).
Plot number defined by user in CPY – Other Settings (Step 4).
Time (0 to maxDT seconds). Vertical line represents start of
calculations.
2
concentration from start of measurement. 0 to
maxDC (ppm)
Maximum negative change in CO
2
concentration (ppm) allowed in a
given session. This value is defined in CPY – Termination Settings (Step