Rockwell Automation Publication IASIMP-QS005H-EN-P - April 2016 17
Risk Assessment and System Design Chapter 1
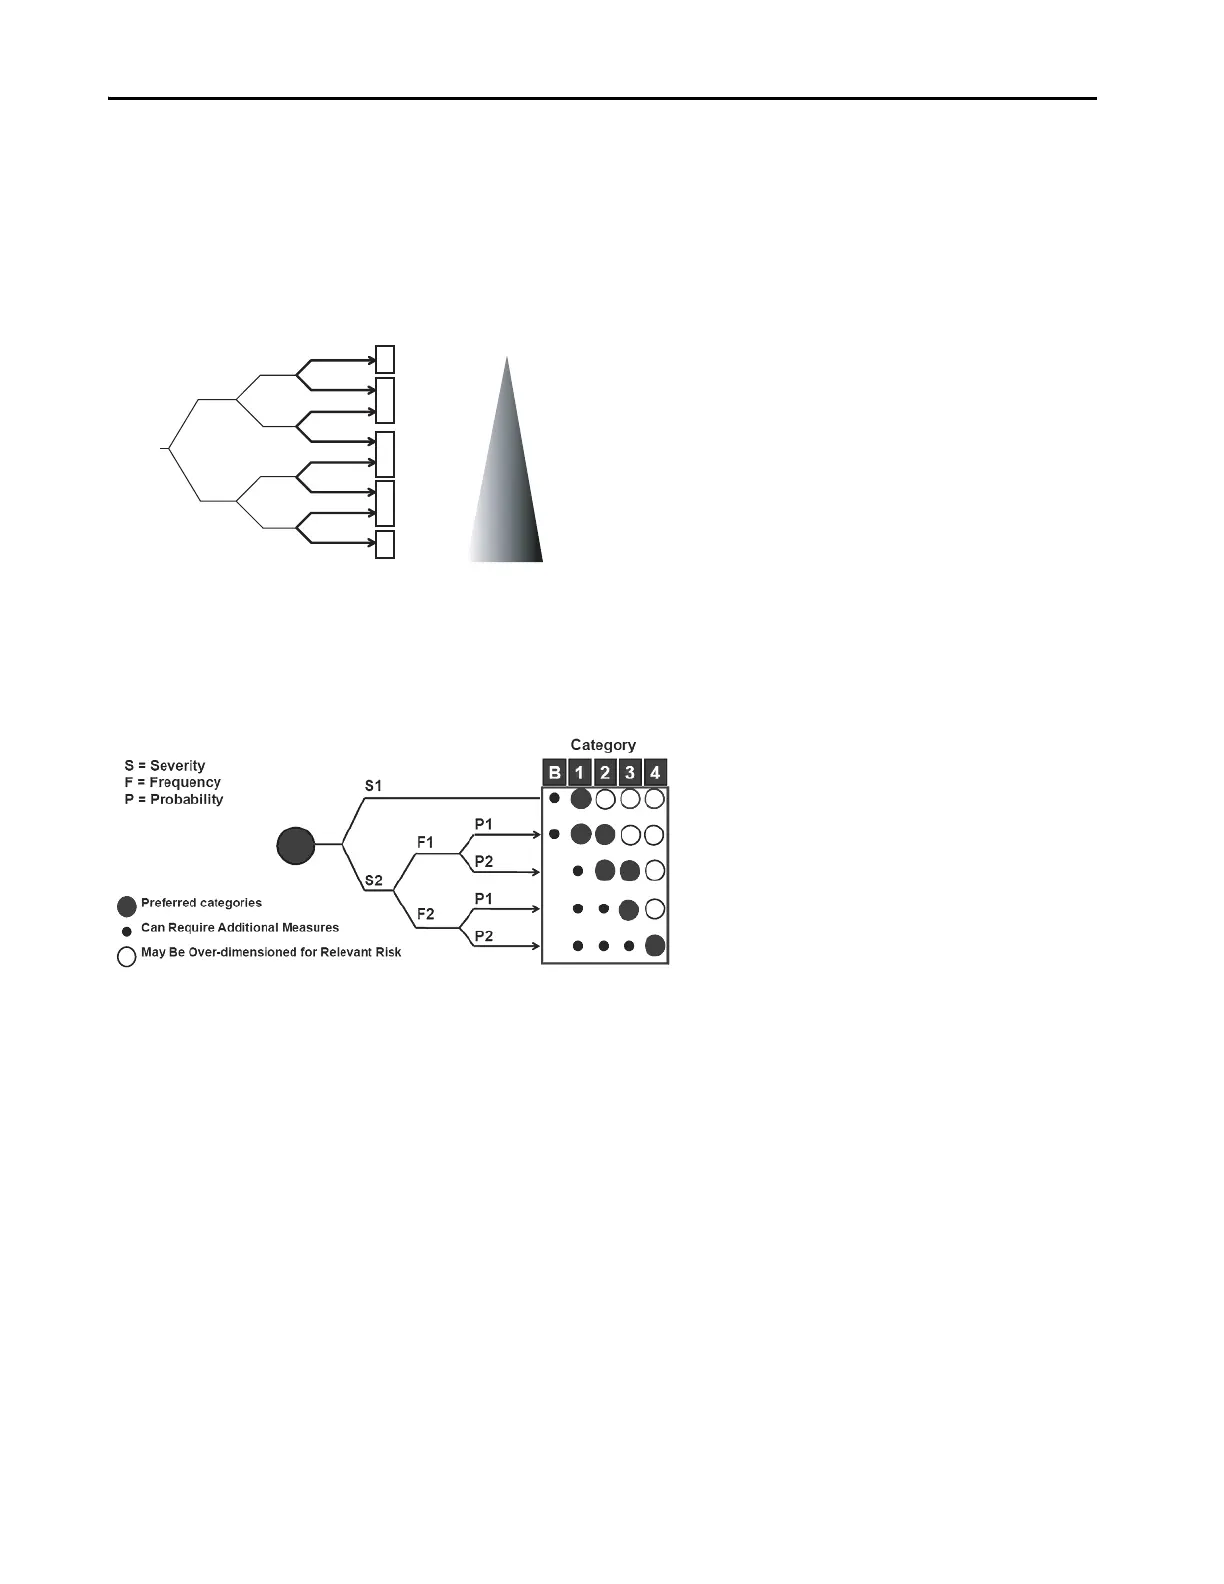
These two risk estimation flow charts are typical methods of defining risk for machinery safety. Other methods are
available for process safety. In fact, many of these types of tools are available. It's important to use these types of processes
to help define the level of risk.
Figure 1 - Risk Graph for Performance Level for a Safety Function (ISO 13849-1:2006
)
Figure 2 - Risk Graph for ISO13849-1:2006 Category Determination
Must be determined for each safety function!
S = Severity
F = Frequency or Duration of Exposure
P = Avoidance Probability
P2
P1
P2
P1
P2
P1
P2
P1
F2
F1
F2
F1
S2
S1
Low
High
b
a
c
d
e
Performance
Level, PLr
Contribution to
Risk Reduction
Start
 Loading...