Functions
8.5 Parameters
FIDAMAT 6
Operating Instructions, 01/2019, A5E00222135-04
99
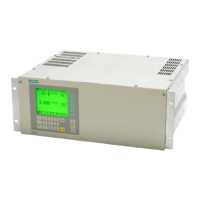
8.5.6 Graphical representation of measured values (function 54)
Figure 8-29 Graphical representation of measured values
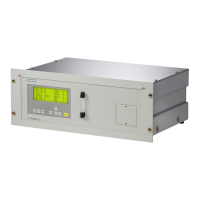
With this function, you can follow the trend of the measured values for the last ten minutes or
24 hours on the display.
Select the desired time period with softkey 1 or 2.
The device now graphs the measured value vs. time:
Figure 8-30 Measured value trend
The most recent measured value is on the time axis at the left at t = 0.
Select softkey 1 "Parameters".
Here, assign a certain measuring range to the measured value axis:
 Loading...