Redstone™ Optical Spectrum Analyzer Chapter 4: Description
Rev C, January 21, 2022 Page 10
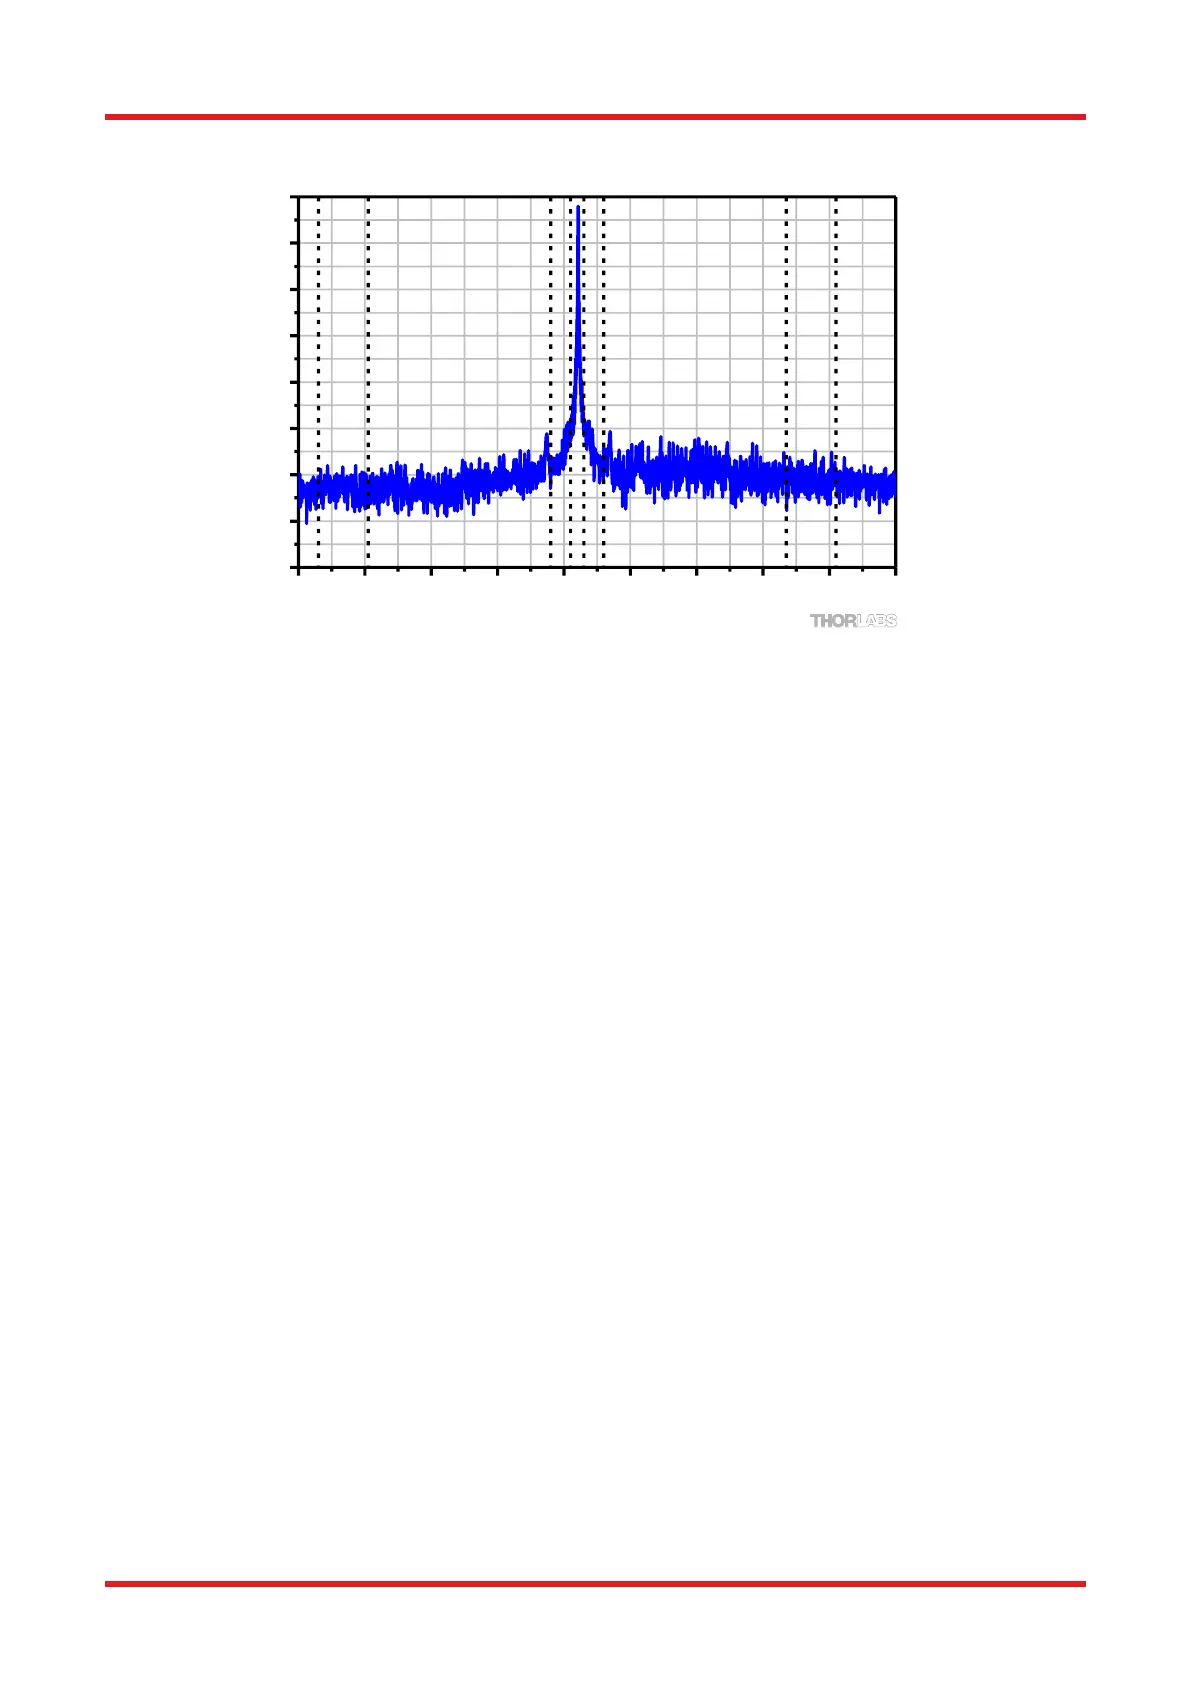
Figure 5. Spectrum of a 1532 nm Frequency-Locked Laser measured by a Redstone OSA305. The
vertical lines represent where the ORR is measured.
4.9. Absolute Power and Power Density
The vertical axis of the spectrum can be displayed as absolute power or power density, both of which can be
represented in either linear or logarithmic scale. In Absolute Power mode, the total power displayed is based
on the actual instrument resolution for that specific wavelength; this setting is recommended to be used only
with narrow spectrum input light. For broadband devices, it is recommended that the Power Density mode is
used. Here the vertical axis is displayed in units of power per x-axis unit, where the x-axis unit is based upon a
fixed range and is independent of the resolution setting of the instrument.
4.10. Apodization
According to Fourier theory, the spectrum of the unknown input light can be exactly determined from the Fourier
transform of the measured interferogram, but only if the interferogram is acquired over an optical path difference
extending from zero to infinity. Of course, the mirrors in the OSA can only translate through a finite distance.
We have therefore implemented several apodization functions in the OSA software to account for the effect of
the finite path length on the measured interferogram.
The measured, finite interferogram can be thought of as an ideal, infinite interferogram that consists of measured
values over a short interval (say, to ) and is equal to zero everywhere else. This treatment is equivalent
to multiplying the measured interferogram (which has measured values from to ) by a boxcar function that
is equal to 1 from to and is equal to zero everywhere else. Mathematically, the Fourier transform of the
product of two functions (i.e., the interferogram and the boxcar function) is equal to the convolution of the Fourier
transform of the first function (i.e., the interferogram) with the Fourier transform of the second function (i.e., the
boxcar). That is, if is defined as the Fourier transform of , then
The Fourier transform of the interferogram is the spectrum, and the Fourier transform of a boxcar function is the
sinc function:. A sinc function is a periodic function with diminishing amplitude away from
zero. Therefore, the Fourier transform of a measured, finite interferogram yields the exact spectrum, but it is
convolved with additional periodic structures that are not representative of the unknown input light.
The effect of the additional periodic structures is strongest when measuring a narrowband source, because the
amplitude of the interferogram of a narrowband source is high over the entire measurement range. To remove
the structures, the interferogram is multiplied by apodizing (dampening) functions that decrease the amplitude

 Loading...


