Redstone™ Optical Spectrum Analyzer Chapter 8: Operation
Page 53 STN053070-D02
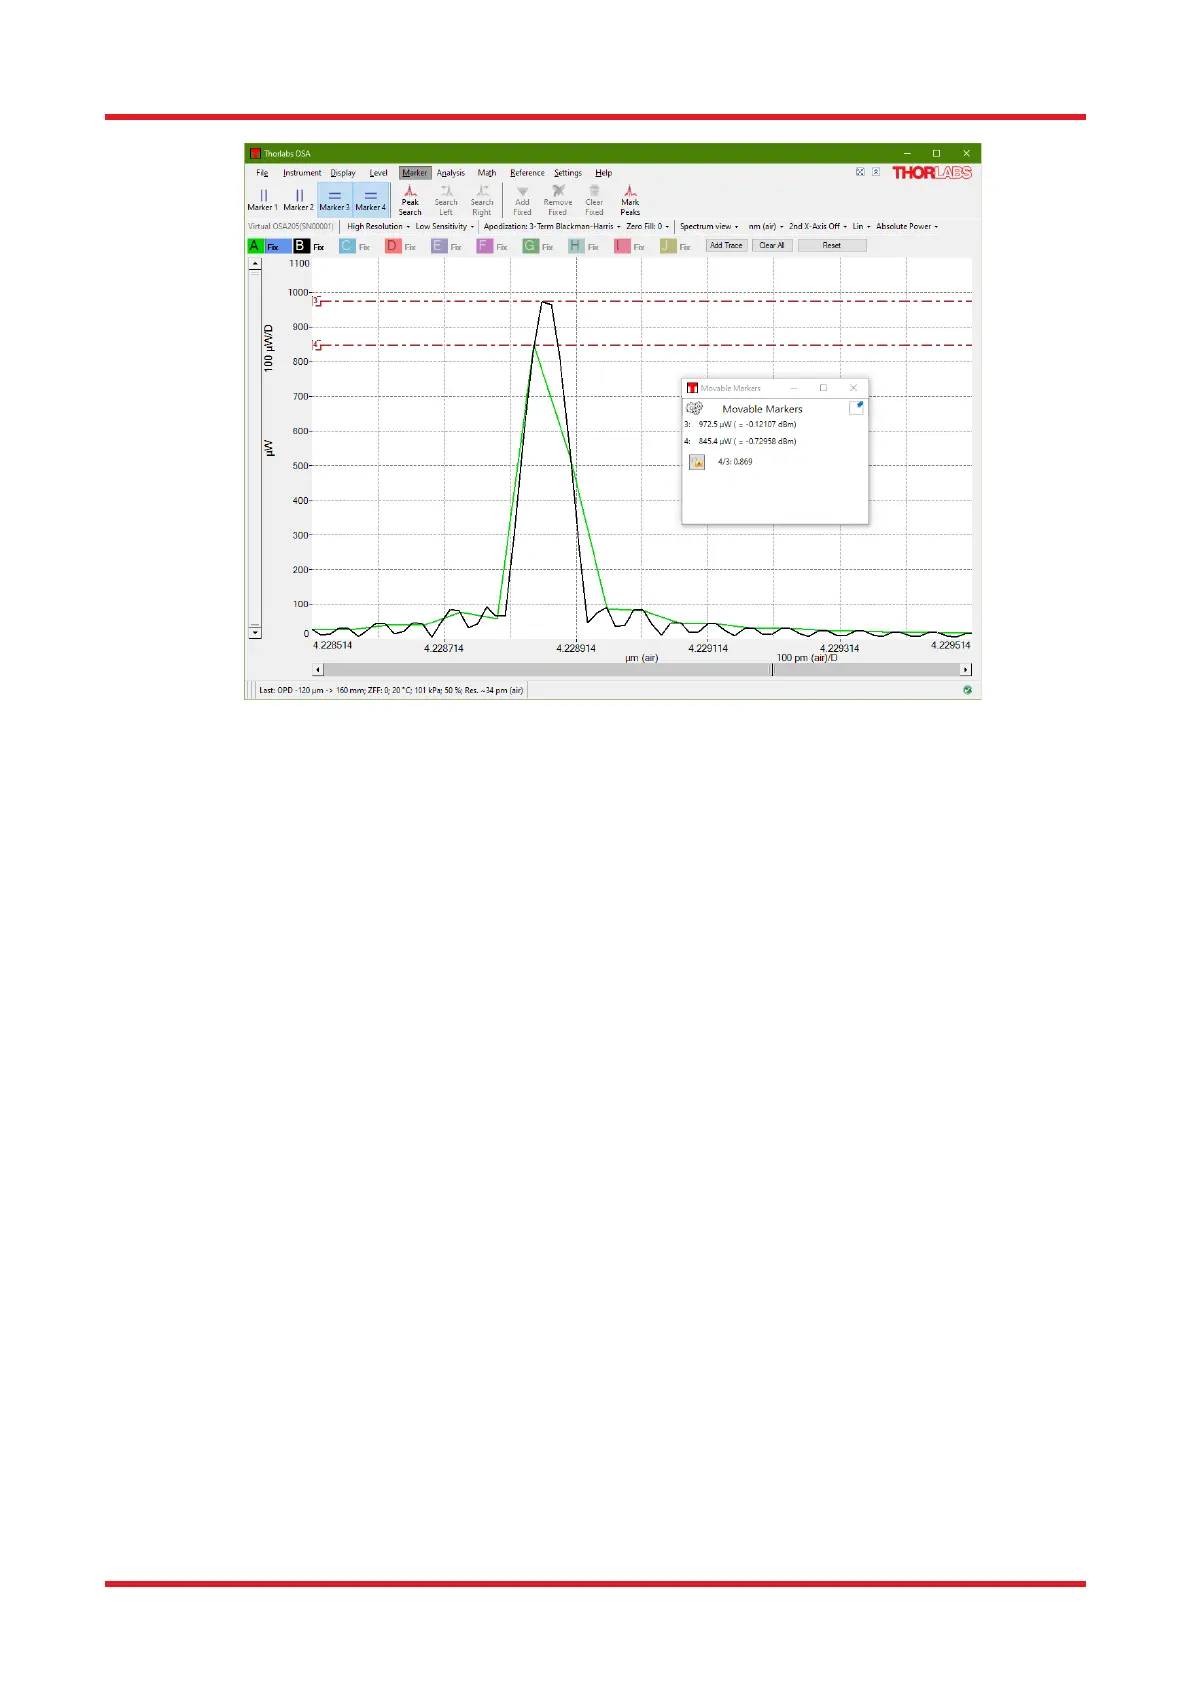
Figure 54. The Zero Fill Factor is Important when Measuring Narrowband Light Sources
Since the wavelength range of the OSA is wide and the dynamic range of the OSA is limited (see Section 4.7
Resolution and Sensitivity), the Power Analysis tool will give an exceedingly high value if the x-axis range is not
limited.
If Dark Room mode (Section 8.3.12) is activated while the Power Analysis tool is active, the display will not be
“dark” until the window is closed and reopened.
8.9.11. Long-Term Analysis
The Long-Term analysis tool is intended for long-term monitoring of optical systems. These tests can track any
output parameter from the analysis tools as well as status parameters of the connected spectrometers.
Setting Up and Running
A long-term test can be started in two ways: by clicking on the “Long-Term” button available in the upper left
corner of each analysis tool window, as shown in Figure 5554, or by clicking the “Long-Term” button under the
Analysis menu. When starting a long-term test directly from an analysis window, only the parameters from the
active analysis tool can be tracked. In contrast, the button found under the Analysis menu enables tracking of
all parameters available for long-term tracking.

 Loading...


