Redstone™ Optical Spectrum Analyzer Chapter 8: Operation
Rev C, January 21, 2022 Page 34
8.7. Working with Data in Traces
The collected interferograms and spectra are stored in what are called “traces.” The Thorlabs OSA software
can handle up to 26 traces labeled from A to Z for spectra and from 1 to 26 for interferograms. The controls for
the traces are found in the area between the data display area and the main menu (see Figure 14). The color
of each trace in the data display area corresponds to the square surrounding the trace icon in the trace control
area; traces which are not currently displayed in the data display area are shown in colors with less saturation
than the displayed traces.
8.7.1. Active Trace
One of the traces will be marked as the Active Trace. This is indicated by the blue background of the Trace
Label, just to the right of the Trace Icon (“A”, “B”, etc.). The Active Trace is the trace onto which all math
operations are applied, the trace that is analyzed by the analysis tools, and the trace that is saved when the
“Save trace” menu item is selected. To designate a trace the active status, click on the Trace Label to open the
Trace Options menu and select “Set as Active.”
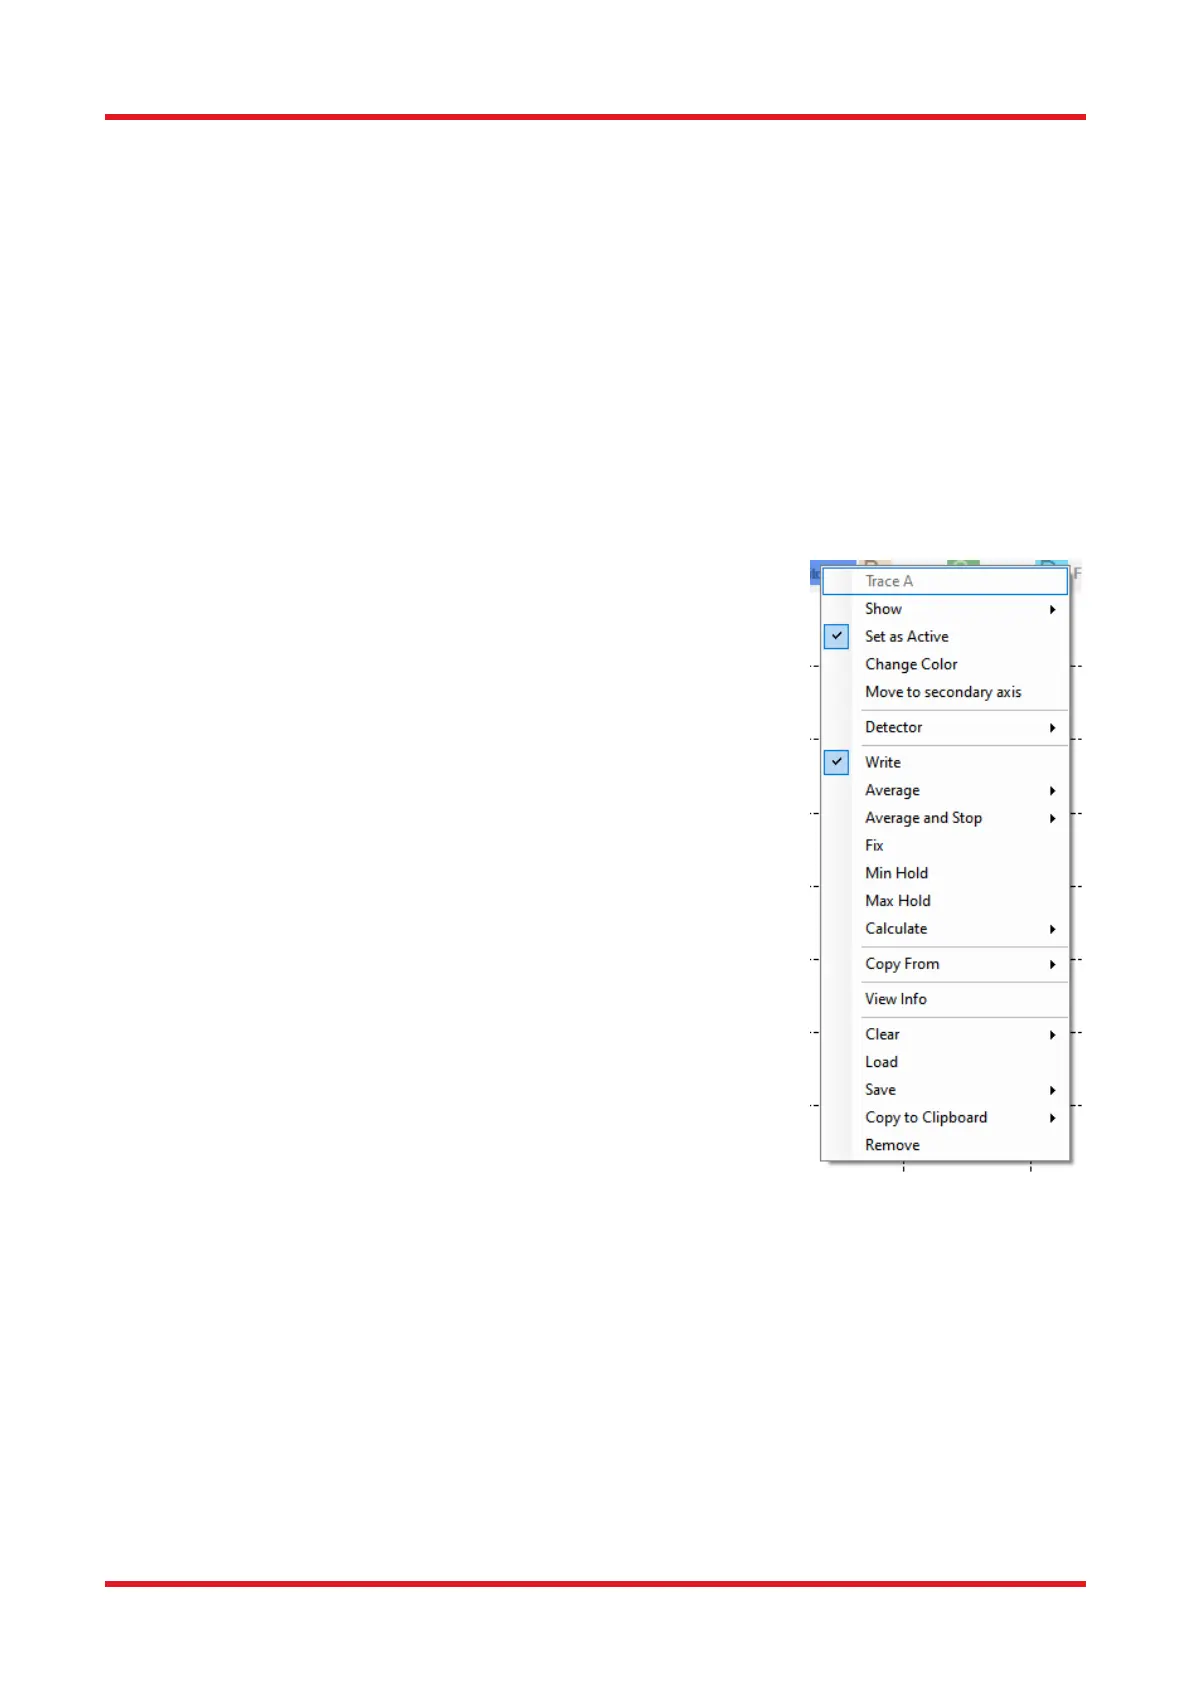
8.7.2. Trace Update Options
The Trace Label to the right of the Trace Icon displays the update option for
the trace. This option determines what will happen with the trace during the
next data acquisition. To change the update option for a trace, click on the
Trace Label to bring up a menu with options and operations for the trace. The
top line of the menu displays the name of the trace. To move a displayed trace
from the primary axis to the secondary axis, click on the option “Move to
secondary axis.” To move the trace back to the primary axis, click on the trace
again; the option will now have changed to “Move to primary axis.” The
secondary axis in the data display area will only be shown if at least one trace
is drawn on it.
The following standard update options are available:
• Write: Traces with this option will be overwritten at the next
acquisition. Interferogram traces (1 through 26) will be overwritten with
the acquired interferogram, and spectrum traces (A through Z) will be
overwritten with the calculated spectrum. Note that inteferogram
traces with “Write” status will be overwritten even if the software is in
Spectrum view, and vice versa. If multiple devices are present, the
option exists to specify the device with which to update the data. For
devices with multiple detectors, it is also possible to select to view data
from one of the detectors or a stitched combination thereof.
• Fix: Traces with this option will not be updated at the next acquisition.
• Average: Traces with this option will be updated at the next acquisition
as a rolling average of the data already existing in the trace and the
newly acquired data. It is possible to let the running average stop
updating once the desired number of spectra has been collected
by selecting the option “Average and Stop.” The Trace Label will show how many spectra have been
collected thus far, e.g., “Avg(1 of 5).”
• Min Hold: Traces with this option will be updated as the minimum of the currently existing data in the
trace and the newly acquired spectrum/interferogram from the selected detector.
• Max Hold: Traces with this option will be updated as the maximum of the currently existing data in the
trace and the newly acquired spectrum/interferogram from the selected detector.
• Difference: Traces with this option will be updated as the difference between two other traces to the
left in the Trace controls bar. The Trace Label will signify how the trace will be calculated, e.g., “B-A” or
“A-C.” This trace will be updated when any of the traces involved in its calculation are updated. This
option is available under the Calculate sub-menu for traces with at least two traces to the left, e.g., this
option is available for traces C and higher.

 Loading...


