Redstone™ Optical Spectrum Analyzer Chapter 8: Operation
Rev C, January 21, 2022 Page 22
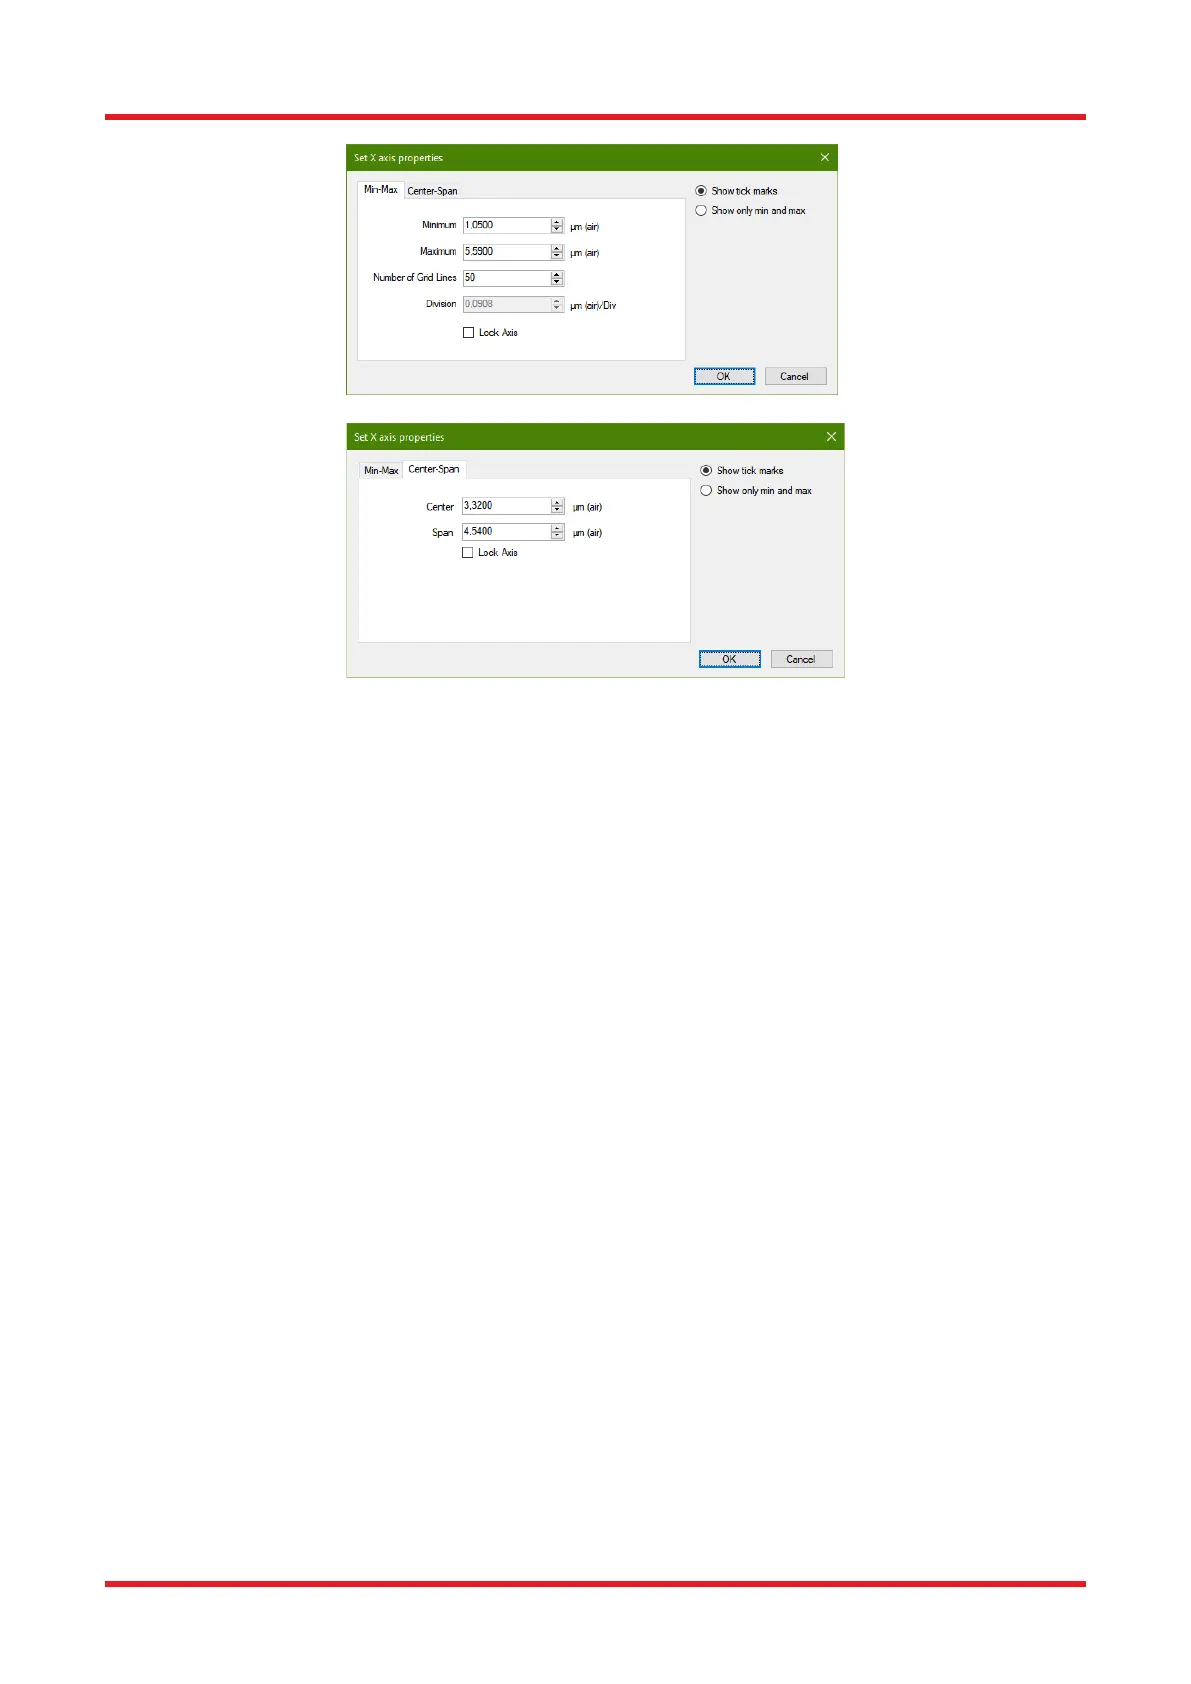
Figure 15. Axis Properties Dialog Opened for the Horizontal Axis
If two vertical line markers are displayed, the horizontal display range can also be set to the range between the
two line markers by opening the Display menu and pressing the button “Get From Line Markers.”
To restore the display area to the full horizontal range, open the Display menu and click the button “Zoom Out”,
or scroll the mouse wheel until the full horizontal axis is displayed.
8.3.2. Zooming and Scrolling the Vertical Axis
The primary vertical axis can be zoomed and scrolled by using the slide bar displayed to the left of the vertical
axis. In the same way, the secondary vertical axis can be zoomed and scrolled using the slide bar displayed to
the right on the secondary vertical axis (this axis is only visible when a trace is plotted on it).
The vertical axis can also be set manually by clicking on the (primary or secondary) vertical axis itself. This will
bring up a dialog box, (similar to the one shown in Figure 15) in which the minimum and maximum values and
division, or alternatively the center value and span, can be set.
Right clicking anywhere in the graph will resize the vertical axis to fit the full vertical range of the currently
displayed data (as determined by the settings for the horizontal axis).
If both level markers are displayed, the vertical range can be set to the range between the level markers by
opening the Level menu and clicking the button “Get From Level Markers.”
Note that the displayed vertical range of the primary and/or secondary can be locked by checking the option
“Lock Axis” in the dialog box displayed above. A locked axis cannot be dragged or zoomed using the mouse or
keyboard in order to prevent an accidental change of the data display range.
8.3.3. Setting the Unit of the Horizontal Axis
In Interferogram view, the horizontal axis unit is set to optical path difference in mm (or µm when suitable), which
cannot be changed.
In Spectrum view, it is possible to change the horizontal axis unit by using the x-axis unit combo box in the
settings bar. The available options are:
• Wavenumber (cm
-1
)

 Loading...


