Redstone™ Optical Spectrum Analyzer Chapter 8: Operation
Page 41 STN053070-D02
If the check box labeled “Use Timestamp in File Name Instead of
File Index” is checked, the file name of the saved spectrum files
will contain the date and time that the spectrum was collected,
down to the millisecond. If this check box is unchecked, the file
names will instead contain a nine-digit number which will
automatically increment with each saved file.
It is also possible to specify a common prefix and suffix for the
files to be saved; the names of the saved files will then be of the
format:
PREFIXxxxxxxxxxSUFFIX.FILEENDING
where “xxxxxxxxx” corresponds to the nine-digit auto-
incrementing number (or timestamp if that option is selected) and
FILEENDING is the default file ending for the selected file format.
The second tab of the dialog box configures time limits on the
automatic saving. The software can be configured to save every
recorded trace, or it can save one trace per user-defined time
interval. In either case, the saving can also be stopped after a
time duration specified by the operating system’s clock, as
configured in the third tab.
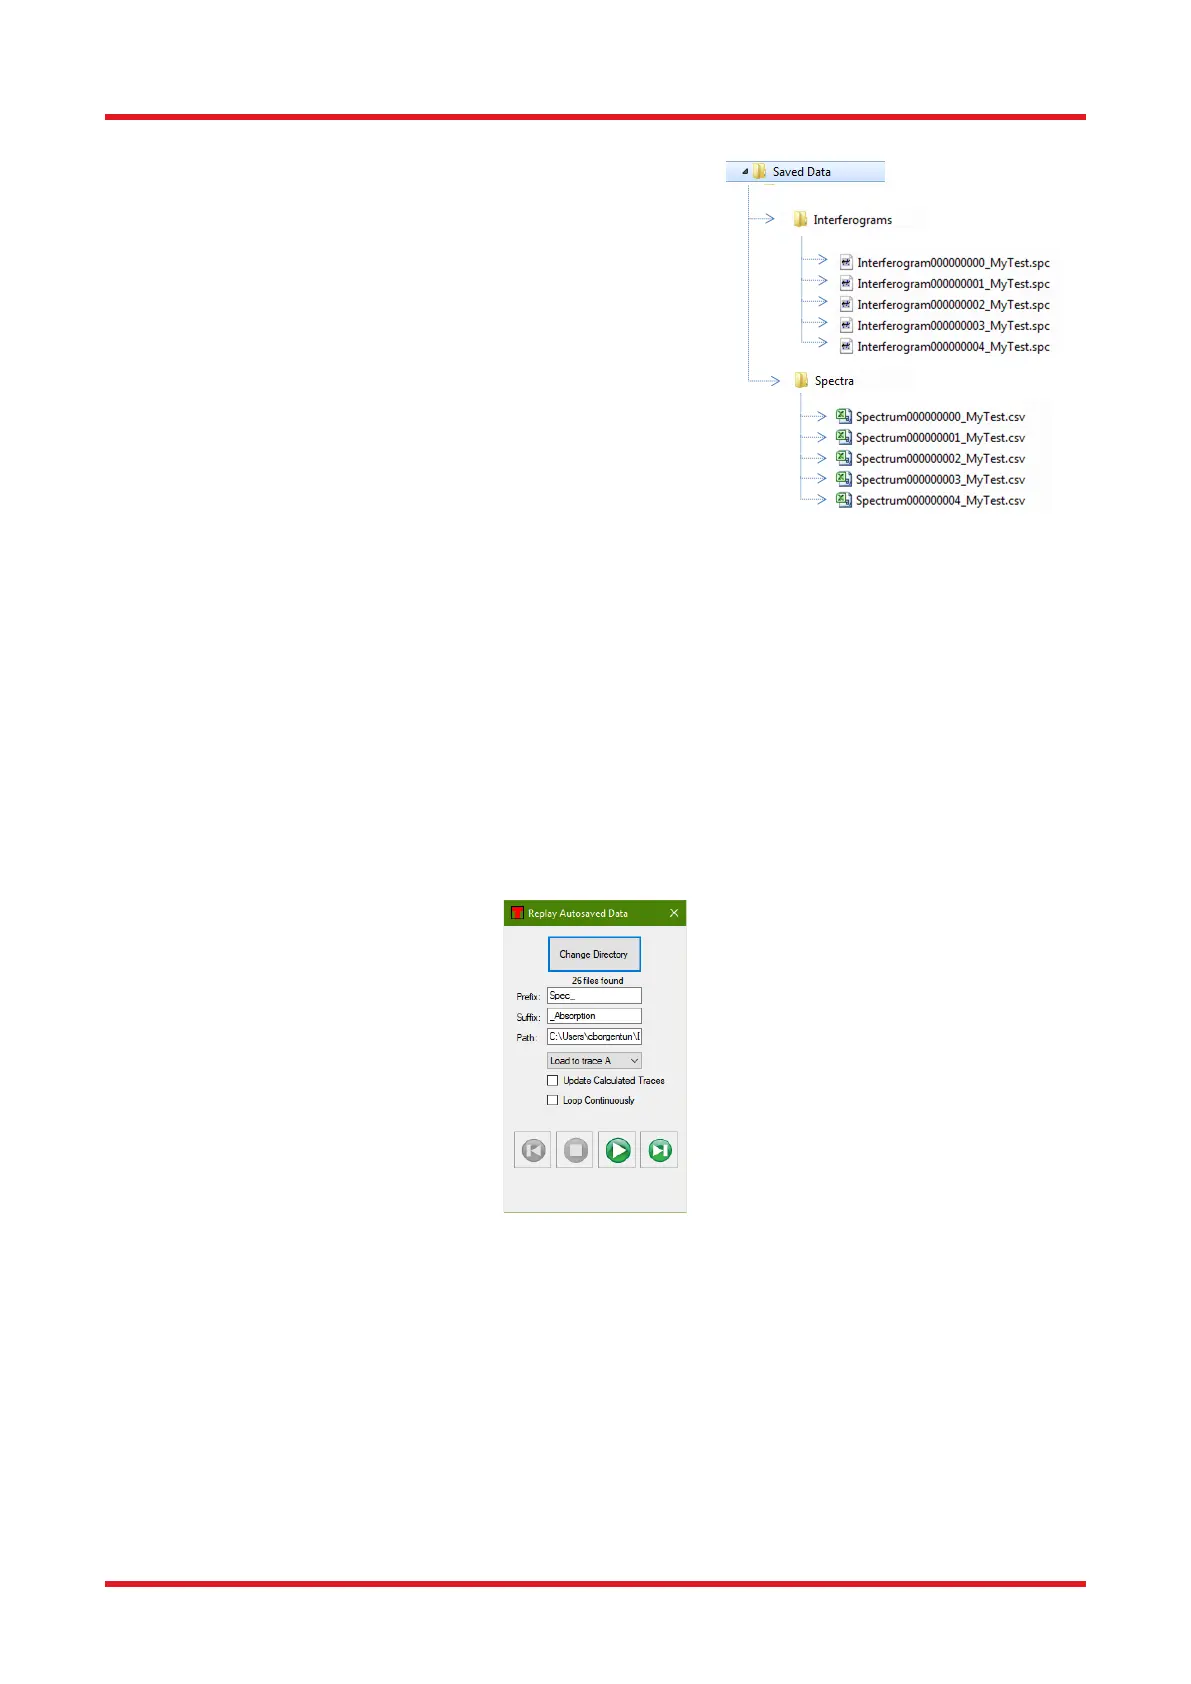
8.8.4. Replaying Automatically Saved Data
The software can recognize data saved by the Autosave feature and replay the measurements at a later date.
Click the “Replay” button in the File menu to bring up the Replay Autosaved Data dialog and click the “Change
Directory” button to select a directory containing data files saved by the Autosave feature. The software will
search for auto-saved files and fill in the Prefix, Suffix, and Path of the found files. The measurements can then
be replayed by clicking the “Play” button to play the entire set of files, or the “Skip ahead” button to show
measurements one by one.
Figure 41. Replay Autosaved Data
8.9. Analyzing Data
The Thorlabs OSA software contains a number of analysis tools, each of which analyzes one aspect of the data
from the spectrometer. The result of each analysis is displayed in a panel below the main data display area, or
in a separate floating window. When an analysis tool is active, the corresponding button in the Analysis menu
will be highlighted. To stop the analysis, click the corresponding button again or click the close button in the
corresponding analysis window.
Some analysis tools have an options panel to the left of the displayed values. In this panel, the settings for the
analysis can be seen and modified.

 Loading...


