Redstone™ Optical Spectrum Analyzer Chapter 8: Operation
Rev C, January 21, 2022 Page 44
If Dark Room mode (Section 8.3.12) is activated while the Wavelength Meter tool is active, the display will not
be “dark” until the window is closed and reopened.
8.9.4. Coherence Length
Coherence length analysis uses the interferogram to estimate the coherence length of the input. The coherence
length measurement looks at the envelope of the interferogram and calculates the coherence length as the
shortest optical path length difference over which the envelope amplitude decreases to 1/e of its maximum on
both sides. If the interferogram is single-sided, the amplitude might not have decreased enough within the data
range. In this case, the envelope amplitude one the long side is checked and estimated on the short side.
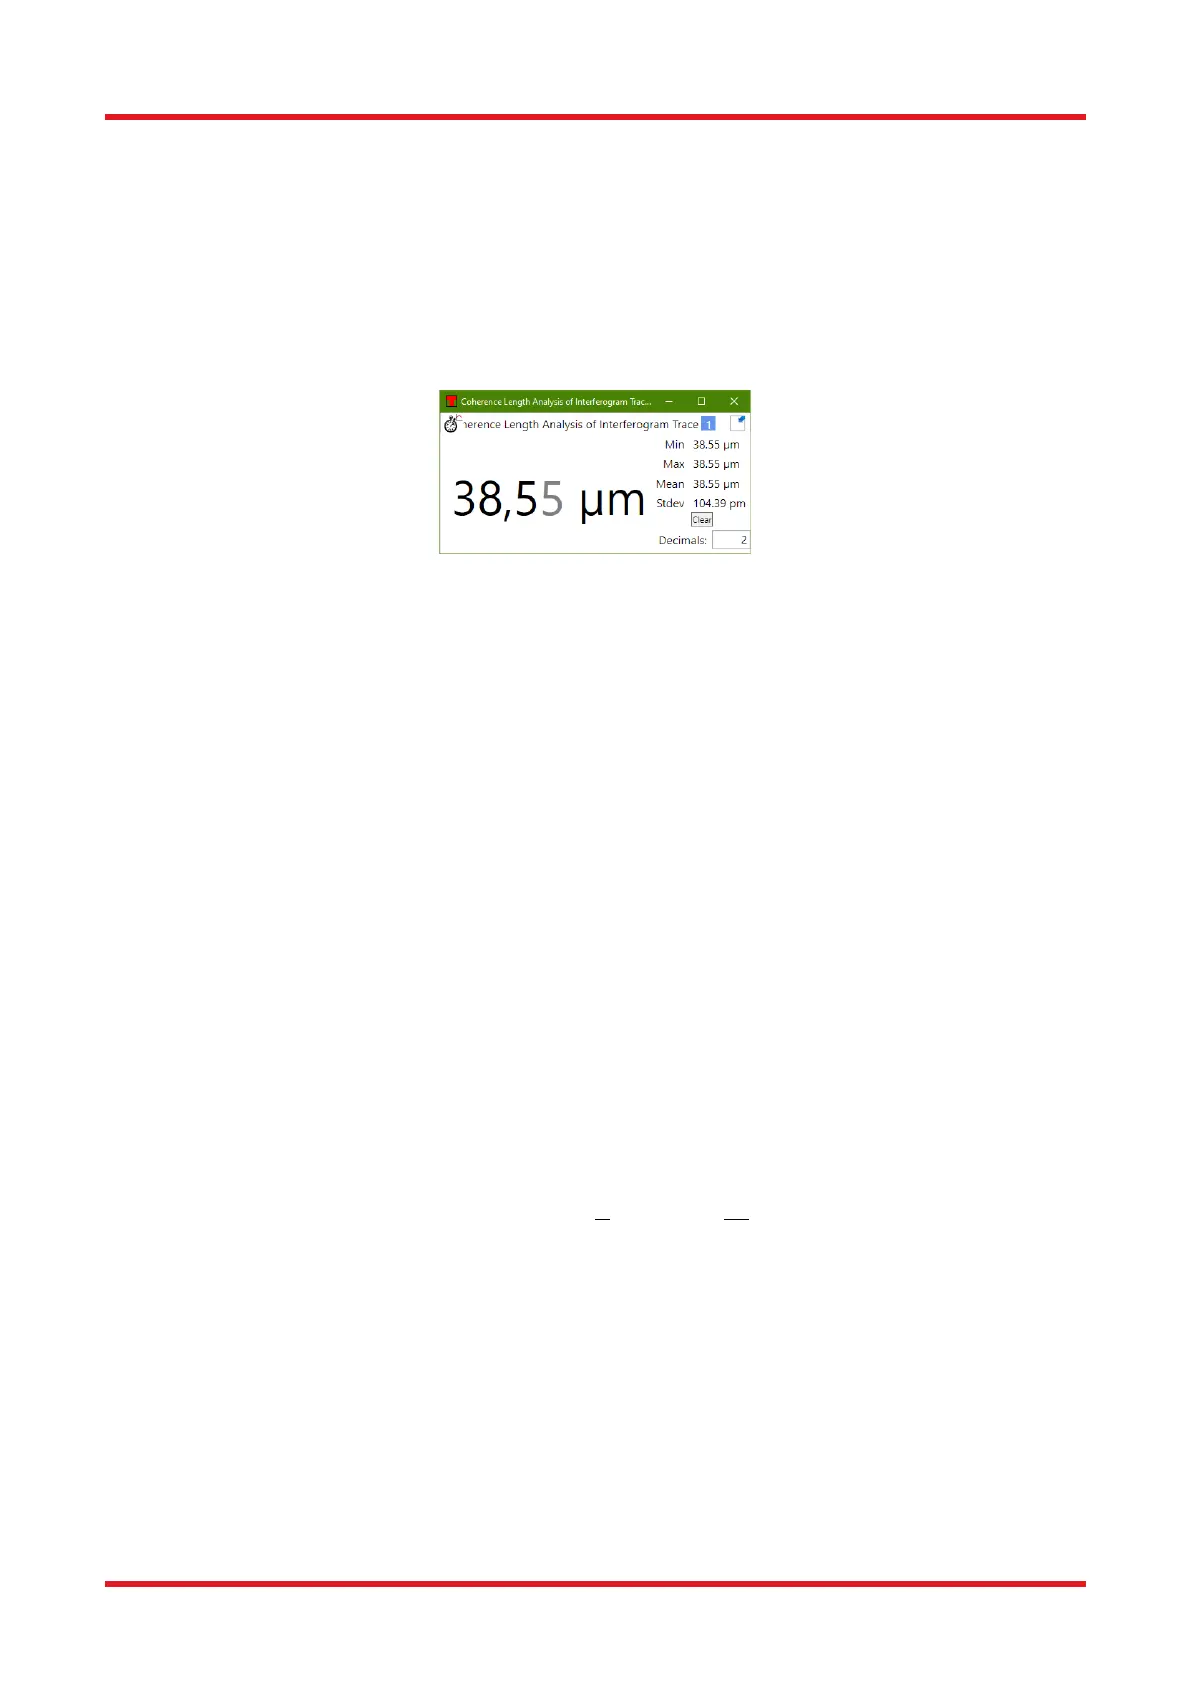
Figure 46. Coherence Length Window
The analysis results are displayed in a floating window or docked below the main display area, as described in
Section 8.9.1. If the coherence length of the input source is longer than the optical path length difference
obtainable by the instrument in the currently active resolution mode, the calculated value will merely be
displayed as larger than the current optical path length.
The Coherence Length analysis tool is very sensitive to detector saturation in the interferogram. Whenever a
saturated interferogram is analyzed, the analysis result will be displayed in red and the error message
“Saturated Interferogram” will be displayed below the analyzed result.
The tool window shows the minimum, maximum, mean, and standard deviation of the coherence lengths that
have been measured while the coherence length tool has been active. The values are updated after every new
sweep. The statistics can be reset by clicking the “Clear” button.
If Dark Room mode (Section 8.3.12) is activated while the Coherence Length tool is active, the display will not
be “dark” until the window is closed and reopened.
8.9.5. OSNR Analysis
The OSNR analysis tool is only available in Spectrum view.
This tool analyzes the Optical Signal-to-Noise Ratio (OSNR) of the Active spectrum trace. It uses the parameters
of the Peak Track tool to automatically find the peaks in the spectrum (see Section 8.9.6).
The OSNR for each peak is calculated as:
Here,
• is the optical power of the peak
• is the interpolated noise at the peak
•
is the optical resolution of the measurement
•
is the reference resolution (0.1 nm)
When multiple peaks are present in the spectrum, the noise at each peak is calculated by the following process.
First, the midpoints between the current peak and the neighboring peaks are found (note that these peaks may

 Loading...


