Redstone™ Optical Spectrum Analyzer Chapter 5: Using the Free-Space Input
Page 15 STN053070-D02
Item # CPA2) to aid in the alignment. Then, use the mirror closest to the OSA to point the alignment beam
emitted by the OSA at the center of the input source. Repeat these steps until the test source beam and
alignment beam overlap over the entire beam path.
When activating the alignment beam on the Redstone OSA, the DC signal of the detectors will be available, the
optimization of which will most often lead to good interferometric signals. Since the DC signals don’t require any
motor motion, the update rate is several Hz and the manual alignment process can thus be completed in a
shorter amount of time.
A portion of the red alignment beam light is coupled out from the Calibration output port on the Redstone OSA
front panel, which can aid in the alignment if the light source is fiber-coupled and emits outside of the visible
range. The test source fiber can then be replaced by a fiber connected to the Calibration output, and the beam
path of the test source is visualized.
If the input test source is sensitive to feedback from the alignment beam, position a suitable dichroic mirror as
close as possible to the test source.
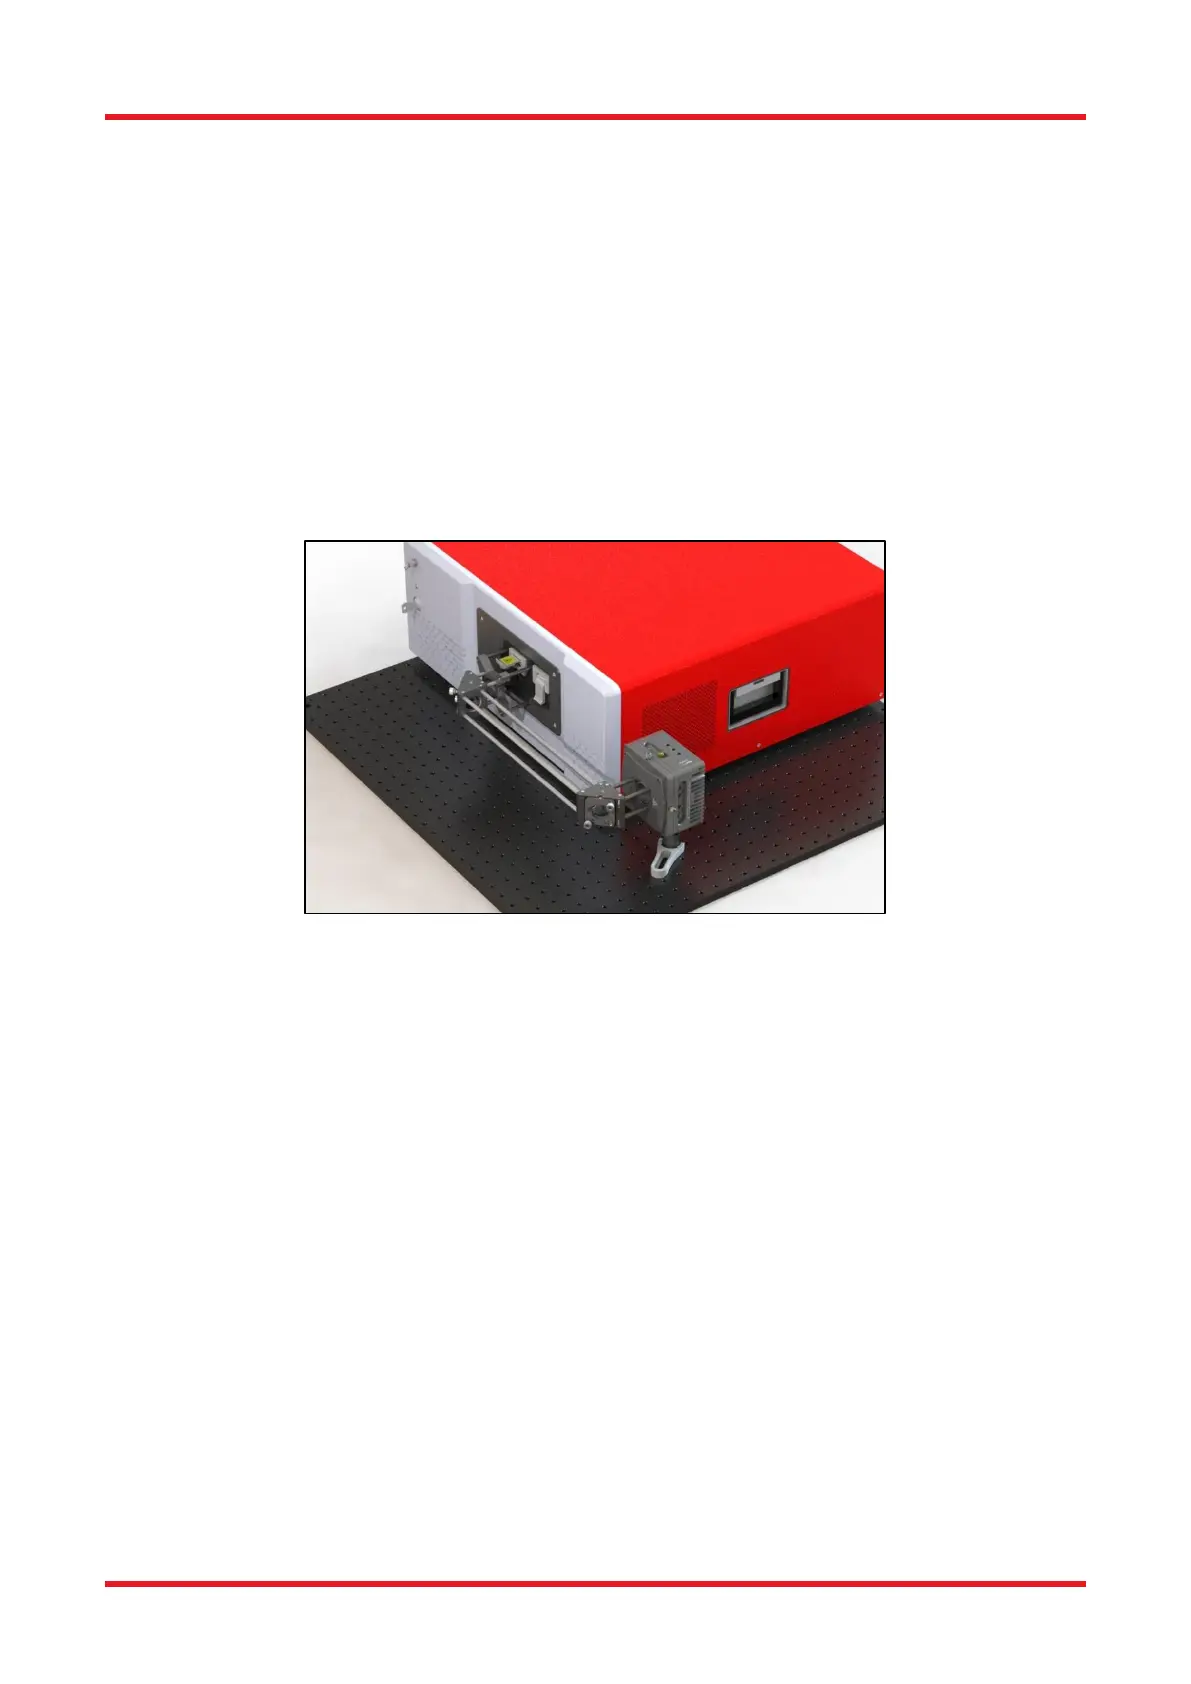
Figure 10. Example Setup for Aligning the Free-Space Input
5.3.2. OSA Software Settings
Once the system is roughly aligned, disable the alignment beam in order to see a spectrum or interferogram in
the main software window. Change the acquisition settings to Low Resolution and Low Sensitivity. Adjust the
gain level(s) such that a strong signal is achieved while not saturating the detector(s); a signal value in the range
of 10% to 80% is suggested. It is recommended to start a time series measurement of the signal and/or power
via the Long-Term functionality (see Section 8.9.11 Long-Term Analysis) to get a reading of how the signal
value and detected input power changes as the two mirrors are adjusted.

 Loading...


