Redstone™ Optical Spectrum Analyzer Chapter 5: Using the Free-Space Input
Rev C, January 21, 2022 Page 16
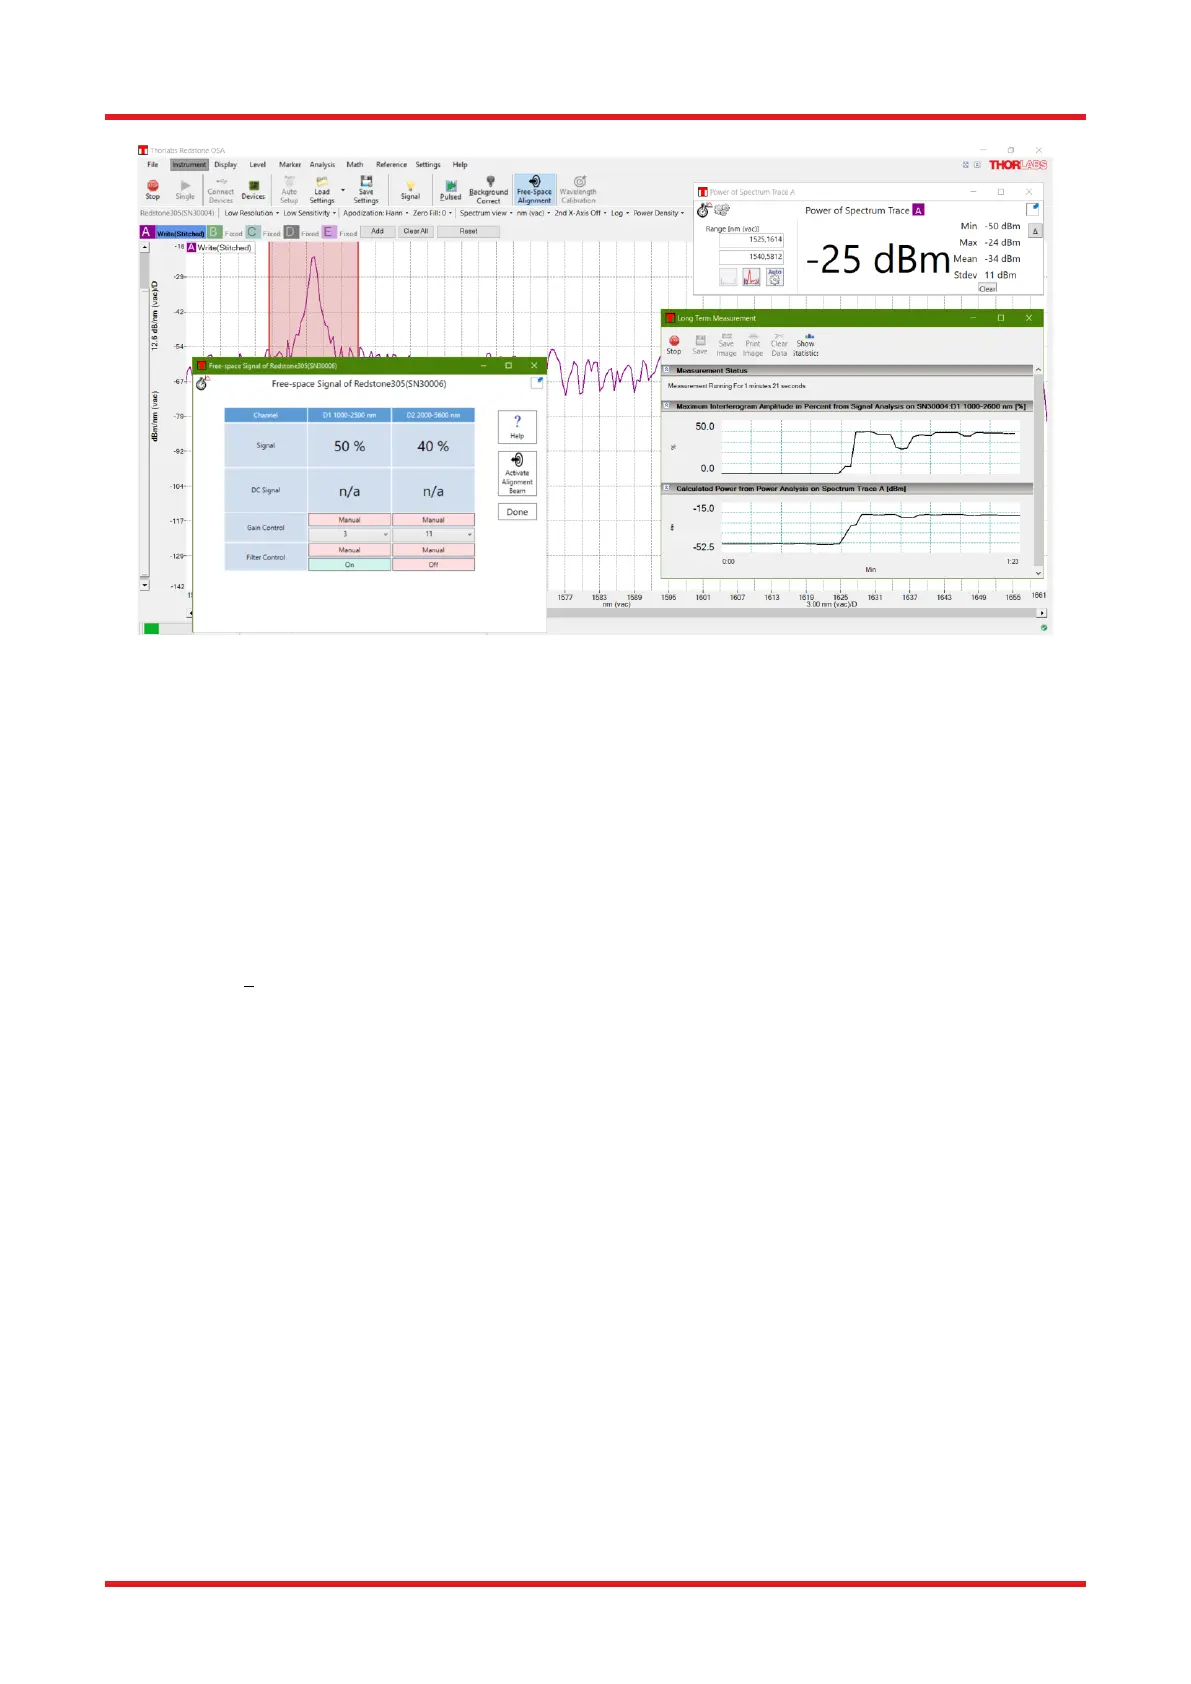
Figure 11. An Example of a Helpful Windows Layout for Free-Space Alignment
5.3.3. Final Alignment
Repeat the alignment process in Section 5.3.1, but utilize the OSA readings instead of the viewing card to
optimize the alignment. Remember to decrease the gain level if any detector gets saturated. The Redstone
OSA305 includes an attenuation filter in front of each detector that can be activated and deactivated with buttons
in the ”Free-space Alignment” window.
5.3.4. Error Estimation
When the signal cannot be optimized further, the wavelength error caused by any remaining misalignment can
be calculated. Measure the offset () between the source exit point and the alignment beam. The wavelength
error is the path difference between the alignment beam and the source beam, and can be estimated as
, where is the distance between the source and the detector. Note: this is the total distance,
i.e. including the distance inside the OSA between the free-space aperture and the detector; 64 cm for Redstone
OSA305. It should be possible to have better than 1 mm for = 1000 mm, which yields an error of less than
5 x 10
-7
(about 1 - 3 pm depending on the source wavelength range).

 Loading...


