Redstone™ Optical Spectrum Analyzer Chapter 8: Operation
Page 25 STN053070-D02
are shown. The menu can be expanded again by pressing the same button or by clicking on any label
of the top level menu.
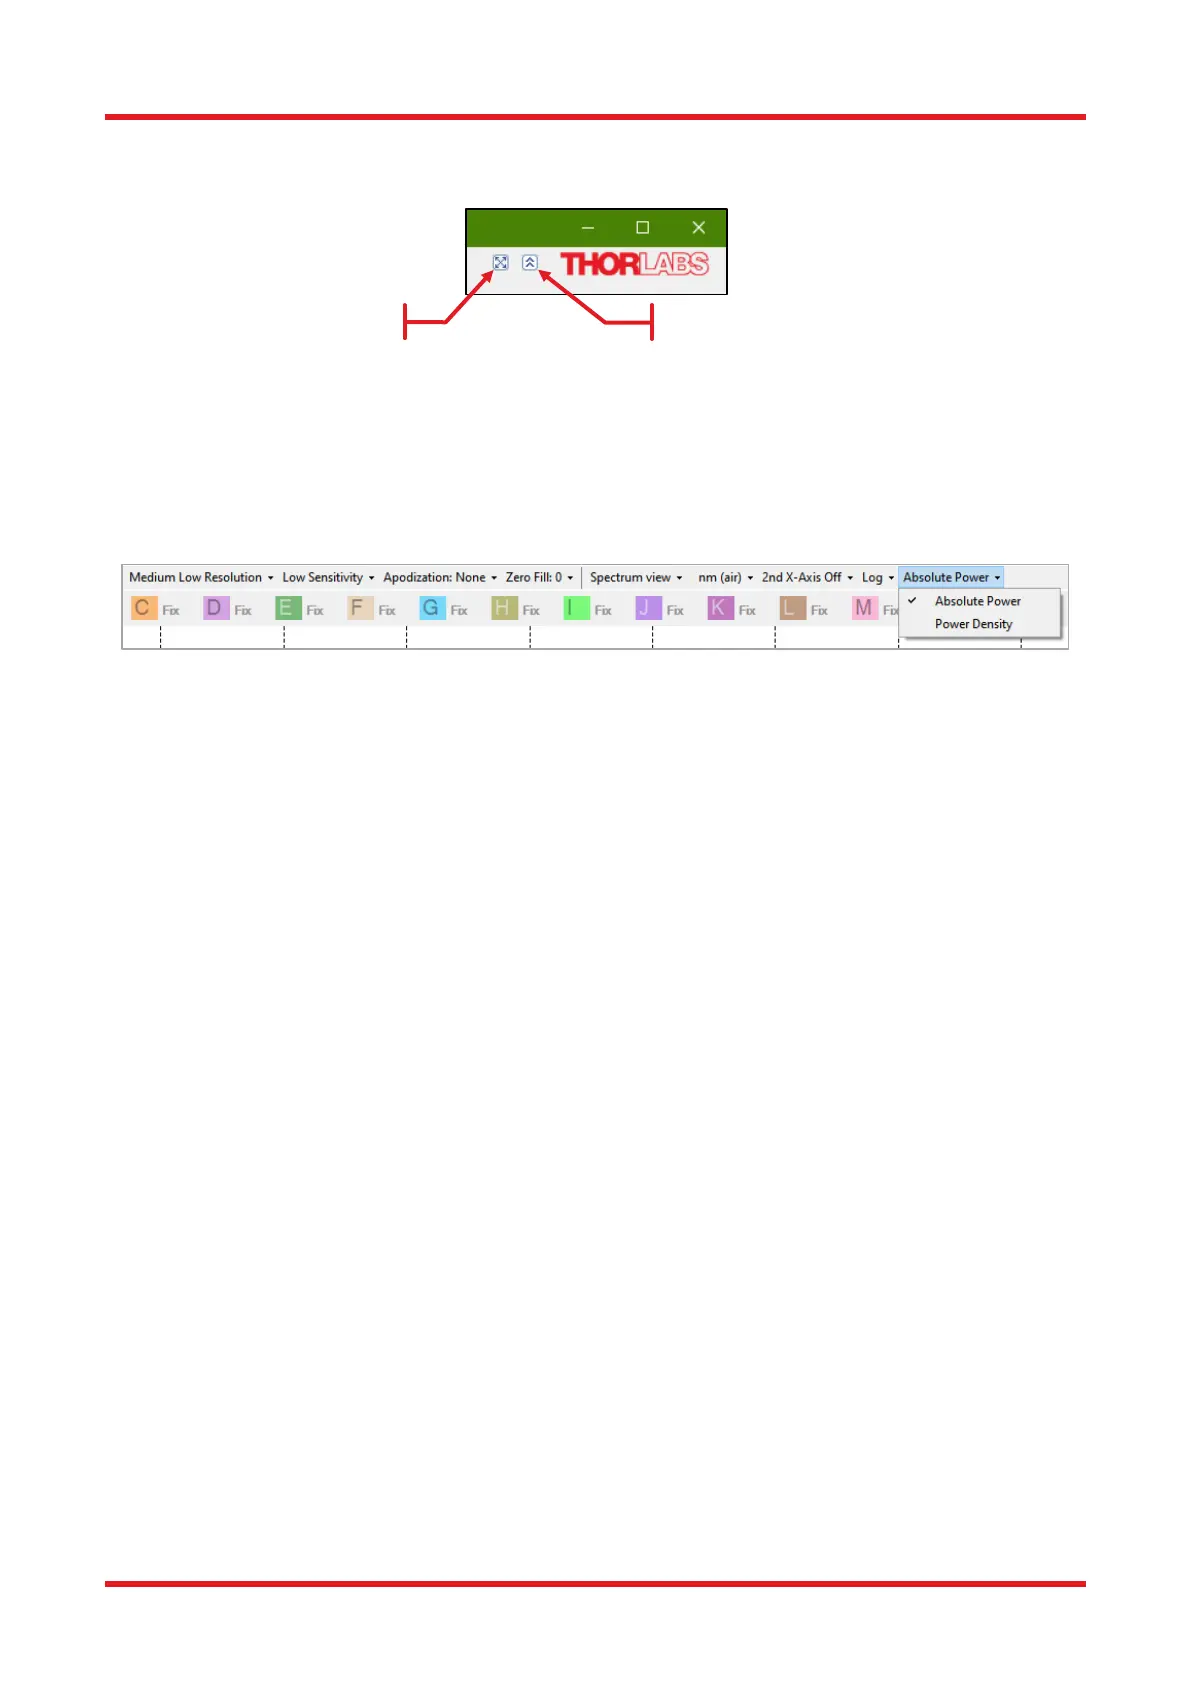
8.3.8. Switching Between Power Density and Absolute Power
The power per wavelength, or frequency, unit is called the power density (e.g., mW/nm or dBm/THz) and the
power per resolution unit is called the absolute power. By default, the Thorlabs OSA is set to display the retrieved
spectra in Absolute Power mode. The display can be switched between Power Density and Absolute Power
mode by using the combo box in the settings bar (see Figure 20).
Figure 20. Switching Between Power Density and Absolute Power Mode
For light coming from a very narrowband source such as a laser, the bandwidth of the source is smaller than
the resolution of the instrument and all the optical power is accommodated within one resolution unit in the
measured spectrum. Thus, the peak level of the measured spectrum is equal to the total power of the light
source when the display is set to Absolute Power.
For light from a broadband source such as LEDs, the bandwidth of the source is much larger than the resolution
of the instrument and the level of the measured spectrum will vary with the resolution mode when the display is
set to Absolute Power. By setting the display mode to Power Density, it is possible to compare spectra from
broadband sources measured at different resolution modes.
• Absolute Power mode is the recommended mode for narrowband sources.
• Power Density mode is the recommended mode for broadband sources.
When the display is set to Absolute Power, the y-axis unit will display the power unit (e.g., nW or dBm). When
the display is set to Power Density the y-axis unit will display the power unit per x-axis unit (e.g., nW/nm or
dBm/cm
-1
).
8.3.9. Displaying a Split View
The Display menu features a combo box, with which additional data can be displayed. Selecting the option “Split
View” will show a secondary display area above the main display area. The two areas show the same data, but
whereas the displayed ranges in both x and y can be adjusted in the lower display, the entire data range is
displayed in the upper display. The horizontal portion of the data range that is not displayed in the lower area is
grayed out in the upper area.

 Loading...


