Redstone™ Optical Spectrum Analyzer Chapter 12: Troubleshooting
Rev C, January 21, 2022 Page 72
Chapter 12 Troubleshooting
Software installation failed
Be sure to have administrative rights on your computer which
enables you to install the software. Ask your system administrator to
give you such rights or to do the installation.
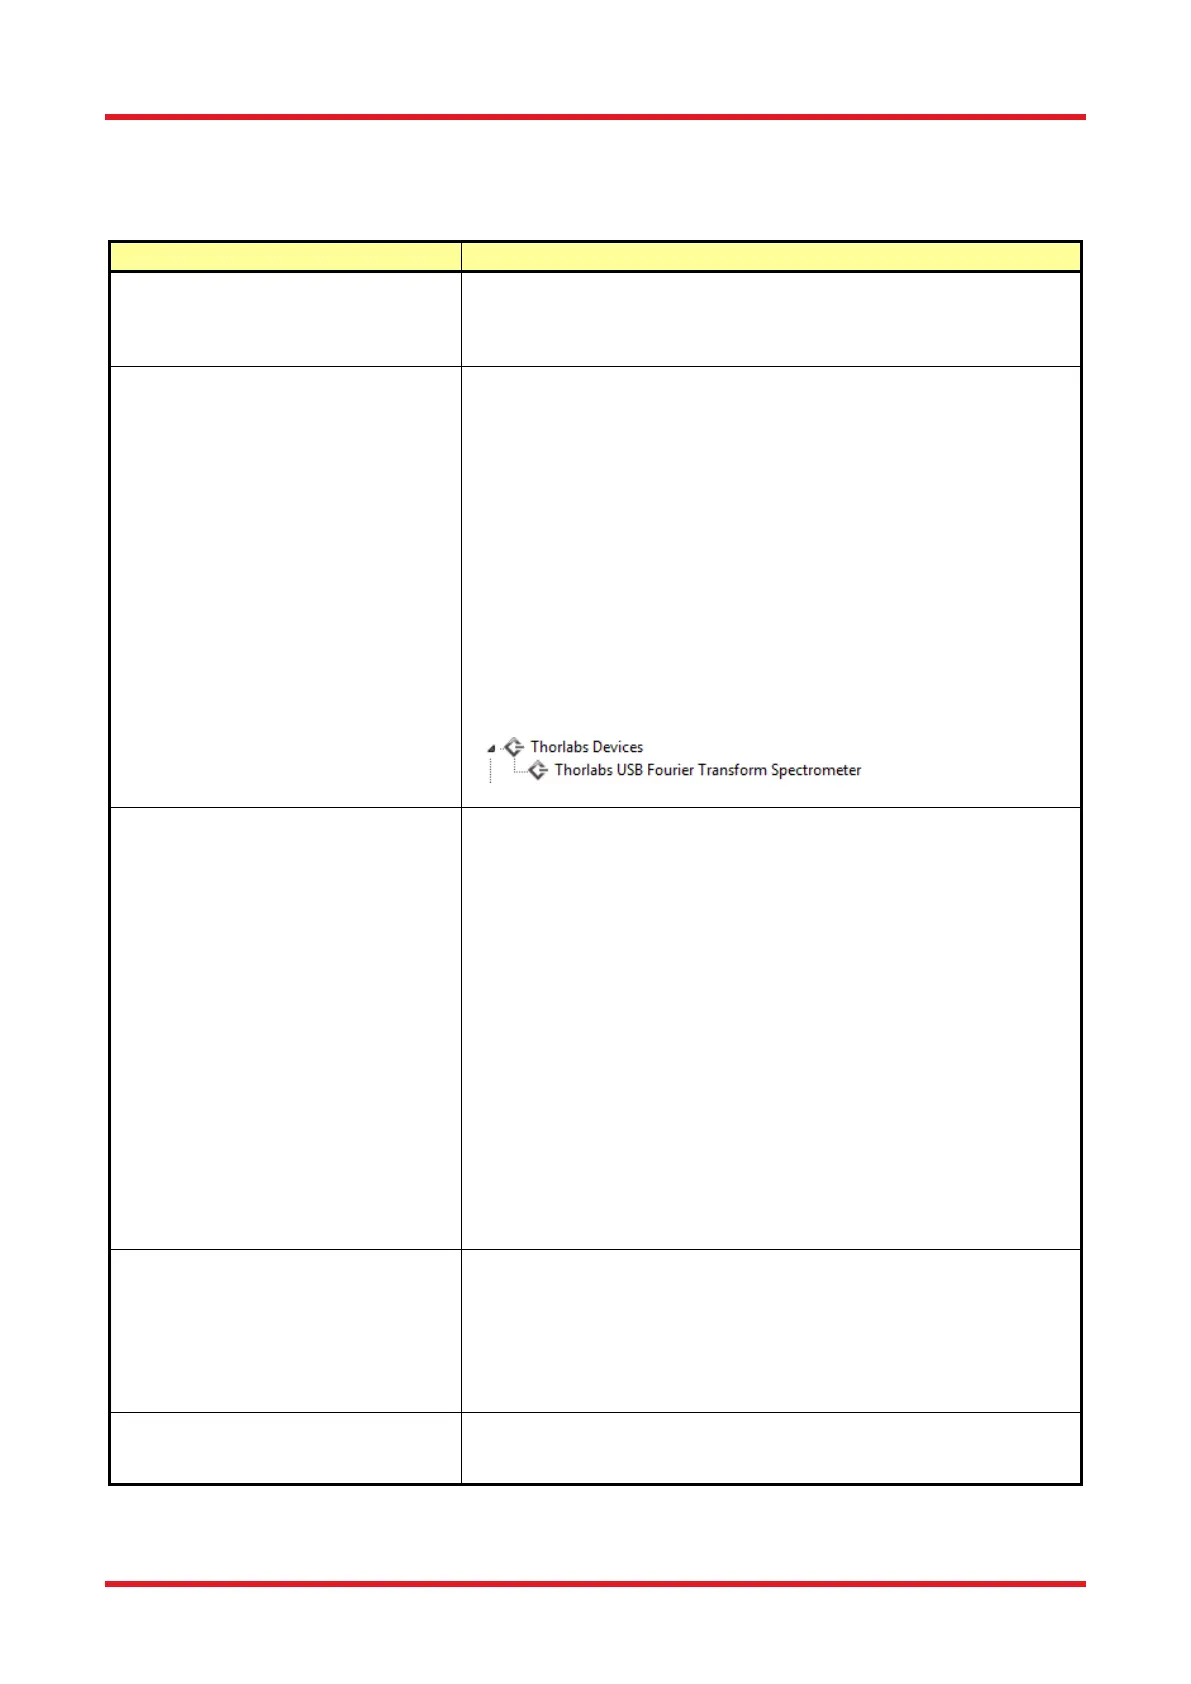
Thorlabs OSA software cannot find
any instrument
If the instrument was connected after the Thorlabs OSA software
was started, it will not automatically detect the instrument. Press the
button “Connect Devices” found under Instrument menu to search
for connected instruments, see Section 8.4.1 Finding the
Spectrometer.
Check that Windows
®
has detected the instrument by opening the
“Device manager” found under the Windows
®
Control panel. The
instrument will be presented under the item “Thorlabs devices”, as
shown below. Note that it might be necessary to select “Show hidden
devices.” If Windows
®
has not detected the instrument, please make
sure that the instrument is turned on and connected to the PC with a
USB cable verified for high speed USB 3.0 communication. If no
instrument is found, check the connection of the USB cable or reboot
the instrument.
I have started the measurement but
the screen doesn’t update
Start by checking your settings;
• Make sure at least one trace is set to “Write” or “Average”,
see Section 8.7.2 Trace Update Options.
• Certain combinations of settings have a very slow update
rate, especially High Resolution/High Sensitivity. Please
check the green progress bar in the bottom left corner. If the
bar is visible, the device is still acquiring or processing data.
• Is the acquisition interval set to anything other than zero
milliseconds? This setting is found in the Settings dialog
under the tab “Acquisition” (you might need to switch to
“Advanced level” in the Settings dialog to see this). The
acquisition interval is the minimum time between two data
acquisitions.
• If the interferogram is saturated or non-linear, the data will
not be shown and a new acquisition is automatically
requested. Open the Signal window and make sure that the
gain is set to Automatic so that the Autogain algorithm can
find optimal settings.
I cannot change the vertical or
horizontal axis of the data display
Check if the axis is locked. This is done by clicking on the axis itself.
If the check box “Lock axis” is checked, the displayed data range on
that axis cannot be changed. This is to prevent accidental dragging
or right-clicking in the graph to change the data range displayed.
Simply uncheck the “Lock axis” check box and click “Ok.” See the
description found under Section 8.3 Customizing the Display.
Bring up the Error log by simultaneously clicking Ctrl+Shift+E. Save
it to file and attach it to an email to techsupport@thorlabs.com.

 Loading...


