Redstone™ Optical Spectrum Analyzer Chapter 8: Operation
Page 49 STN053070-D02
where is the number of samples and is the average value over the analyzed range.
• Standard Deviation: The sample standard deviation of the trace over the analyzed range. This is the
square root of the sample variance above.
• RMS: The root mean square (RMS) value of the trace over the analyzed range.
• Weighted Average: The average x-axis value over the analyzed range, weighted by the absolute
value of the y-axis.
• Minimum Value: The smallest value of the trace over the analyzed range.
• Maximum Value: The largest value of the trace over the analyzed range.
• Number of Values: The total number of values in the over the analyzed range.
• Contains NaN: Equal to true if the trace contains a data point with a “Not a number” value in the
analyzed range, and equal to false otherwise.
• Contains Inf: Equal to true if the trace contains a (positive or negative) infinite value in the analyzed
range, and equal to false otherwise.
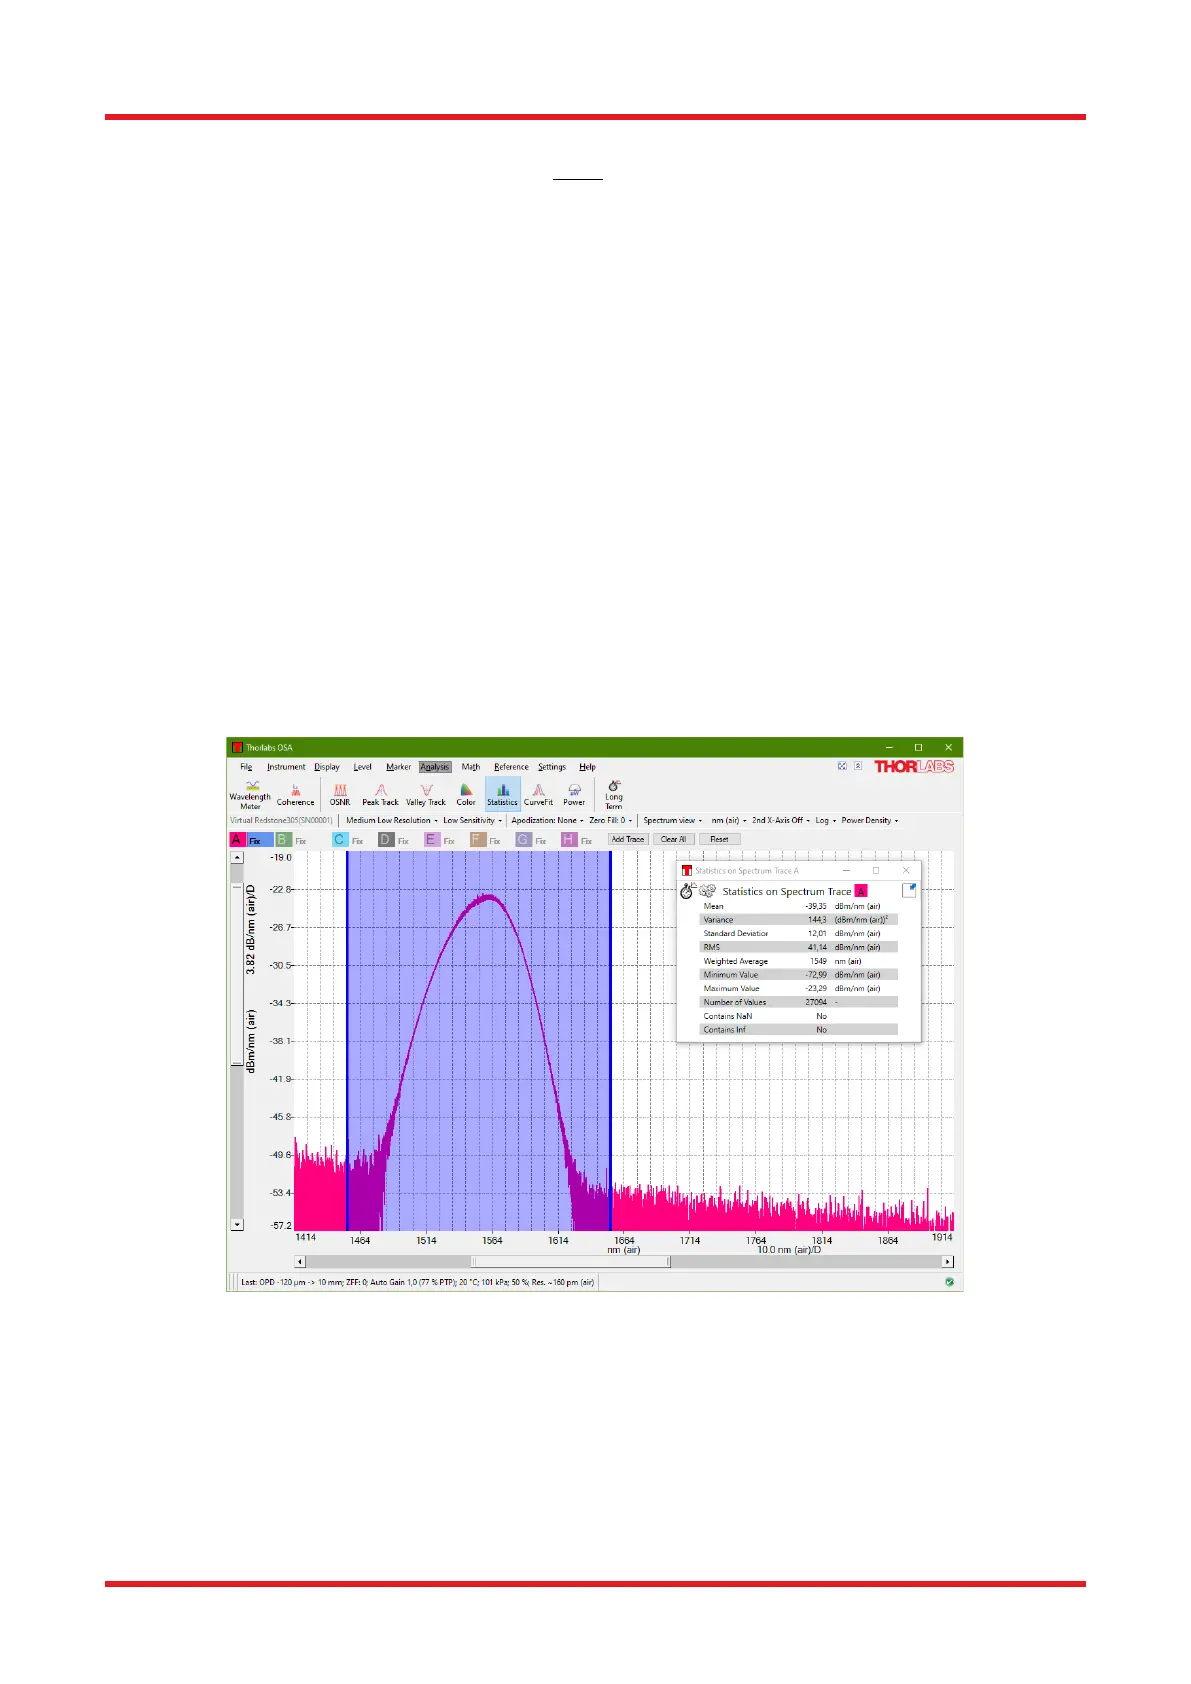
Figure 50. Statistics Analysis Window
8.9.9. Curve Fit
The Curve Fit tool allows a mathematical function to be fit to an active trace over user-specified x-axis and y-
axis intervals.
When the Curve Fit tool is enabled, an analysis window is docked below the main data display area. This window
contains three parts. The leftmost section lets the user see and edit the x-axis range over which the
mathematical curve is fitted, the middle section displays information about the fit, and the rightmost section

 Loading...


