Redstone™ Optical Spectrum Analyzer Chapter 8: Operation
Rev C, January 21, 2022 Page 42
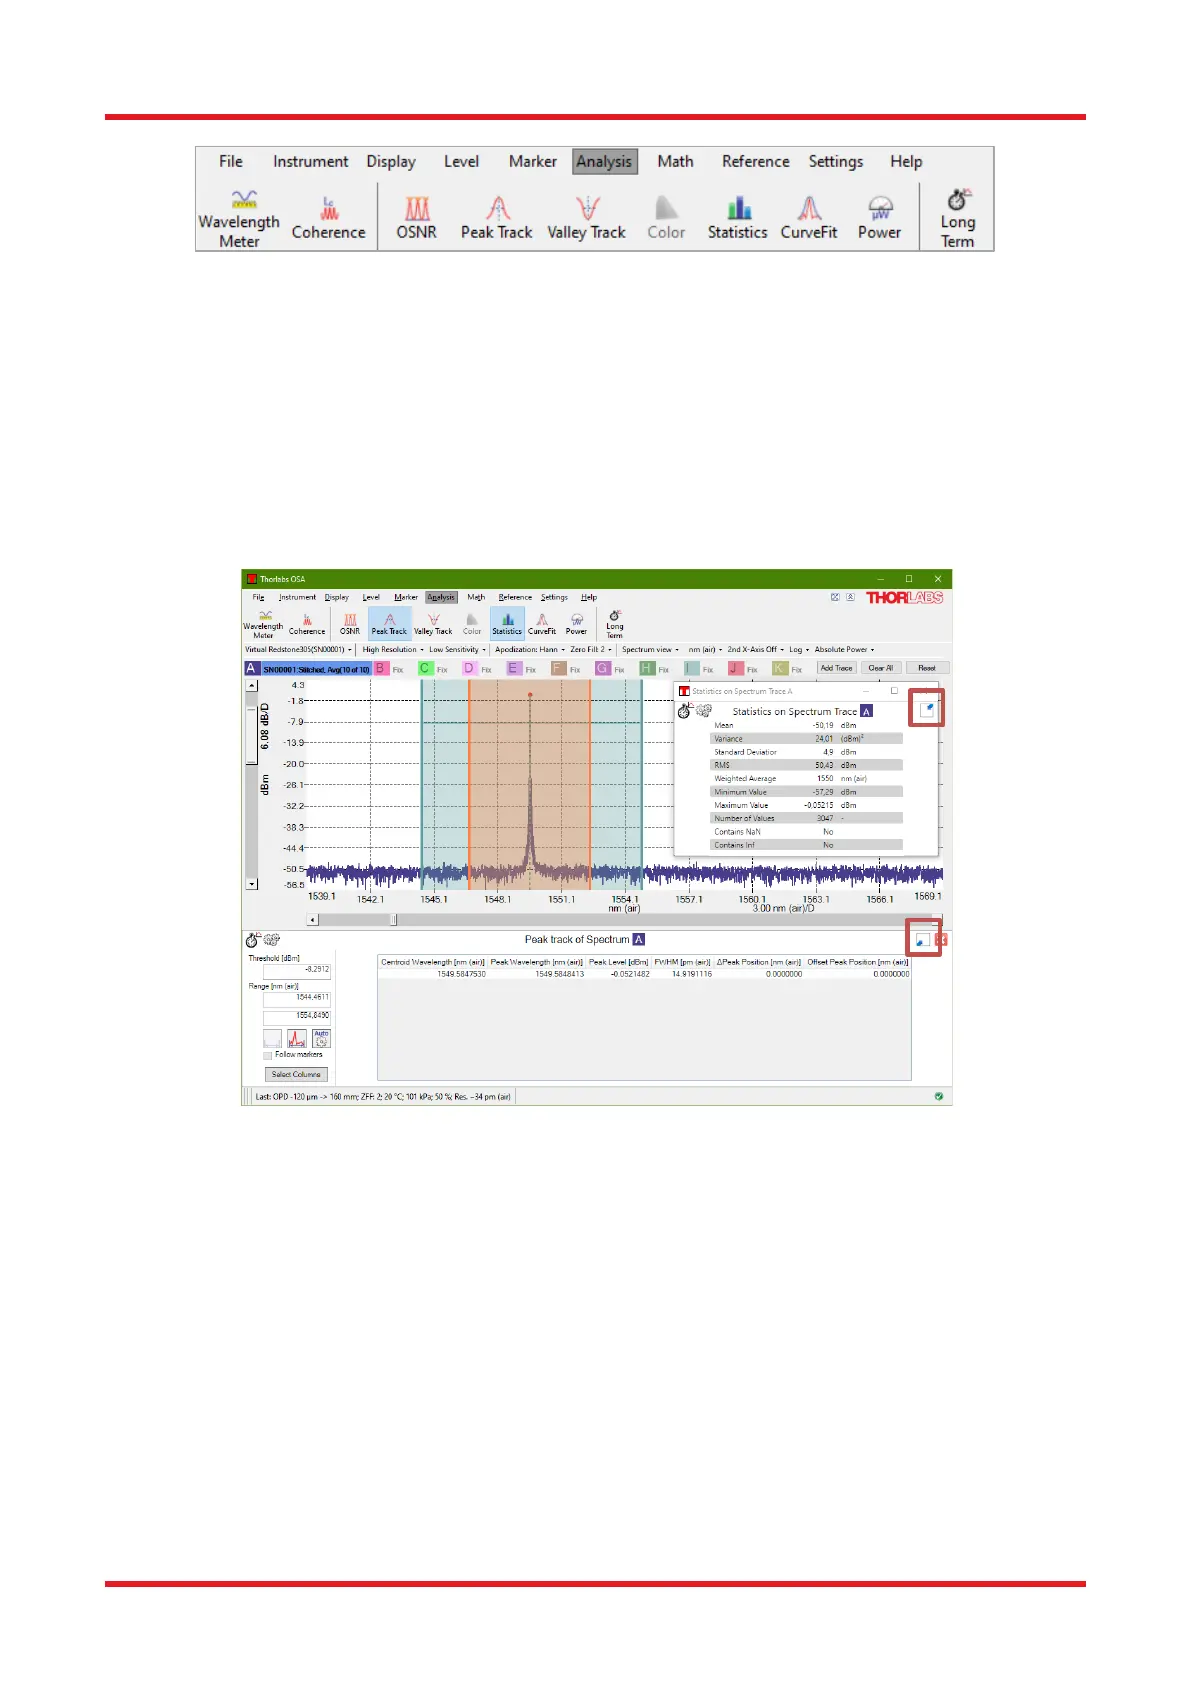
Figure 42. Analysis menu. Not all analysis tools are available in all views for all spectrometers.
8.9.1. Floating Windows
Analysis results that do not contain large amounts of data (and therefore do not require much space) are shown
in a floating window above the upper-right part of the main data display area (see Figure 4342). The floating
window can be rescaled and moved. If the window is shrunk, some of the data will be hidden; enlarging the
window makes the data reappear. The floating window can also be docked below the graph by clicking the
docking button, which has a down arrow and is marked in Figure 4342.
Analysis results that require more space will be docked by default. They can be moved into a floating window
by clicking the undocking button, which has an up arrow and is marked in Figure 4342.
Figure 43. Analysis Displayed Beneath the Main Data Display Area and in a Floating Window
8.9.2. Displayed Range and Threshold
In some analysis tools, it is desirable to constrain the analysis to a certain portion of the trace. For these tools,
a range and/or a threshold can be defined. The range and/or threshold are displayed as lines directly in the
main data display, making it easy to see the part of the input signal being analyzed. The analysis range can be
modified either by dragging the lines or by typing new values into the boxes in the analysis window.
If the range and threshold lines are not wanted, they can be removed from the graph by unchecking “Display
Analysis Region in graph” in the analysis settings window, which is opened by clicking on the small cogwheels
icon in the upper left corner of the analysis window. The analysis settings window also allows the fill color of the
analysis region to be changed and the fill to be disabled entirely.
By pressing the “Auto” button in the analysis window, the range and/or threshold will be set to values that are
automatically determined from the displayed range of the main data display area.

 Loading...