Redstone™ Optical Spectrum Analyzer Chapter 8: Operation
Page 43 STN053070-D02
Figure 44. Power Analysis tool with Enabled Range Lines and Fill
8.9.3. Wavelength Meter
The Wavelength Meter analysis tool very accurately determines the wavelength of the input light to the
spectrometer. This analysis is only available for light from sources with a bandwidth of 10 GHz or less. This tool
works by analyzing the periodicity of the collected interferograms before apodization is performed. The number
of cycles in the interferogram are counted and compared to the number of cycles in the interferogram of the
built-in reference laser (see Section 4.1 Introduction).
When the Wavelength Meter tool is enabled, the analysis results are displayed in a floating window or docked
to the main display area, as described in Section 8.9.1 Floating Windows. The calculated wavelength is
displayed in the currently set x-axis spectral units. If the input light does not have sufficiently narrow linewidth
for the analysis to work properly, the text “Invalid Value” will be displayed instead of a number. The calculated
wavelength is displayed with an accuracy that corresponds to the estimated error in the measurement. If the
source shows multimode behavior, the number of significant decimals displayed will be reduced to reflect the
reduced precision of the measurement. The analysis estimates the error in the measured wavelength, displaying
the significant digits in black and the not significant digits in gray. The control “Decimals” in the options panel
makes it possible to manually set the number of decimals to display.
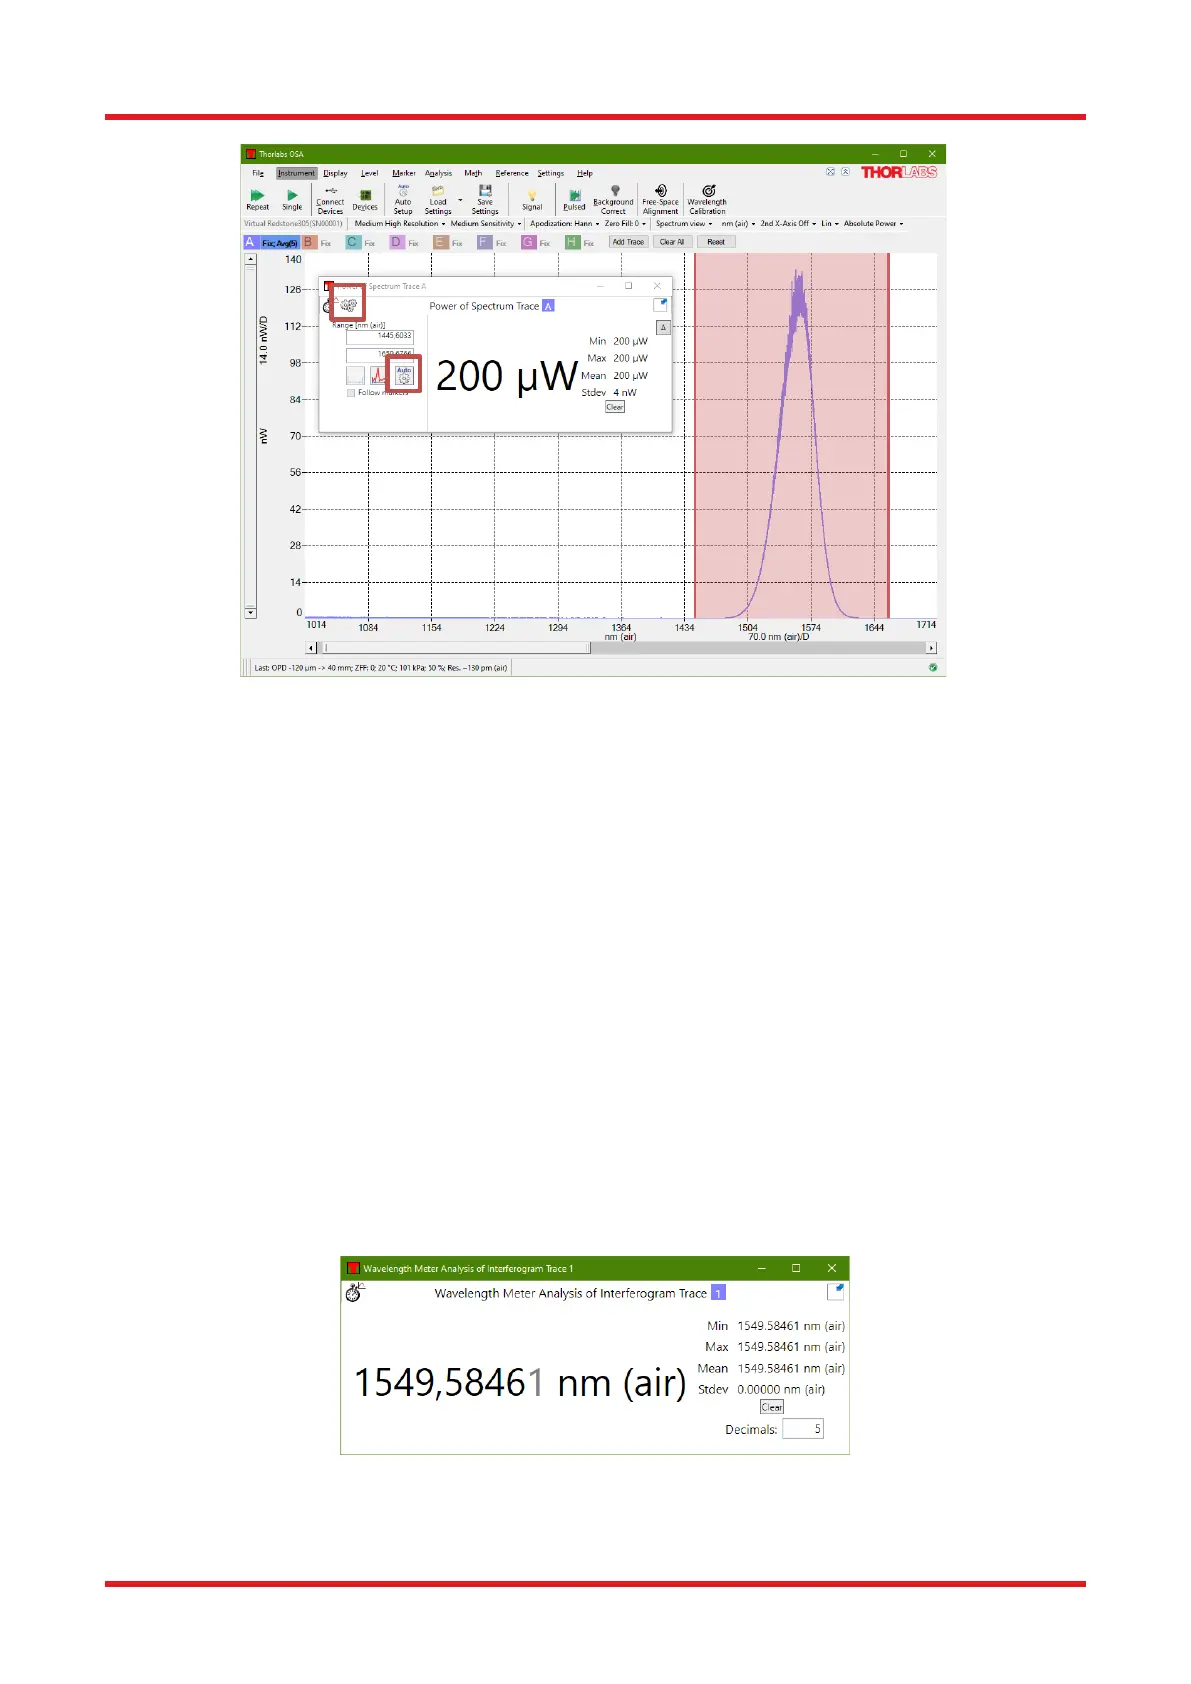
The tool window shows the minimum, maximum, mean, and standard deviation of the wavelengths that have
been measured while the wavelength meter tool has been active. The values are updated after every new
sweep. The statistics can be reset by clicking the “Clear” button.
Figure 45. Wavelength Meter Window
Note that the wavelength metering is performed on the interferogram during the collection process prior to
apodization and it is not necessary to turn off the apodization for this analysis tool to function.

 Loading...


