Redstone™ Optical Spectrum Analyzer Chapter 4: Description
Page 9 STN053070-D02
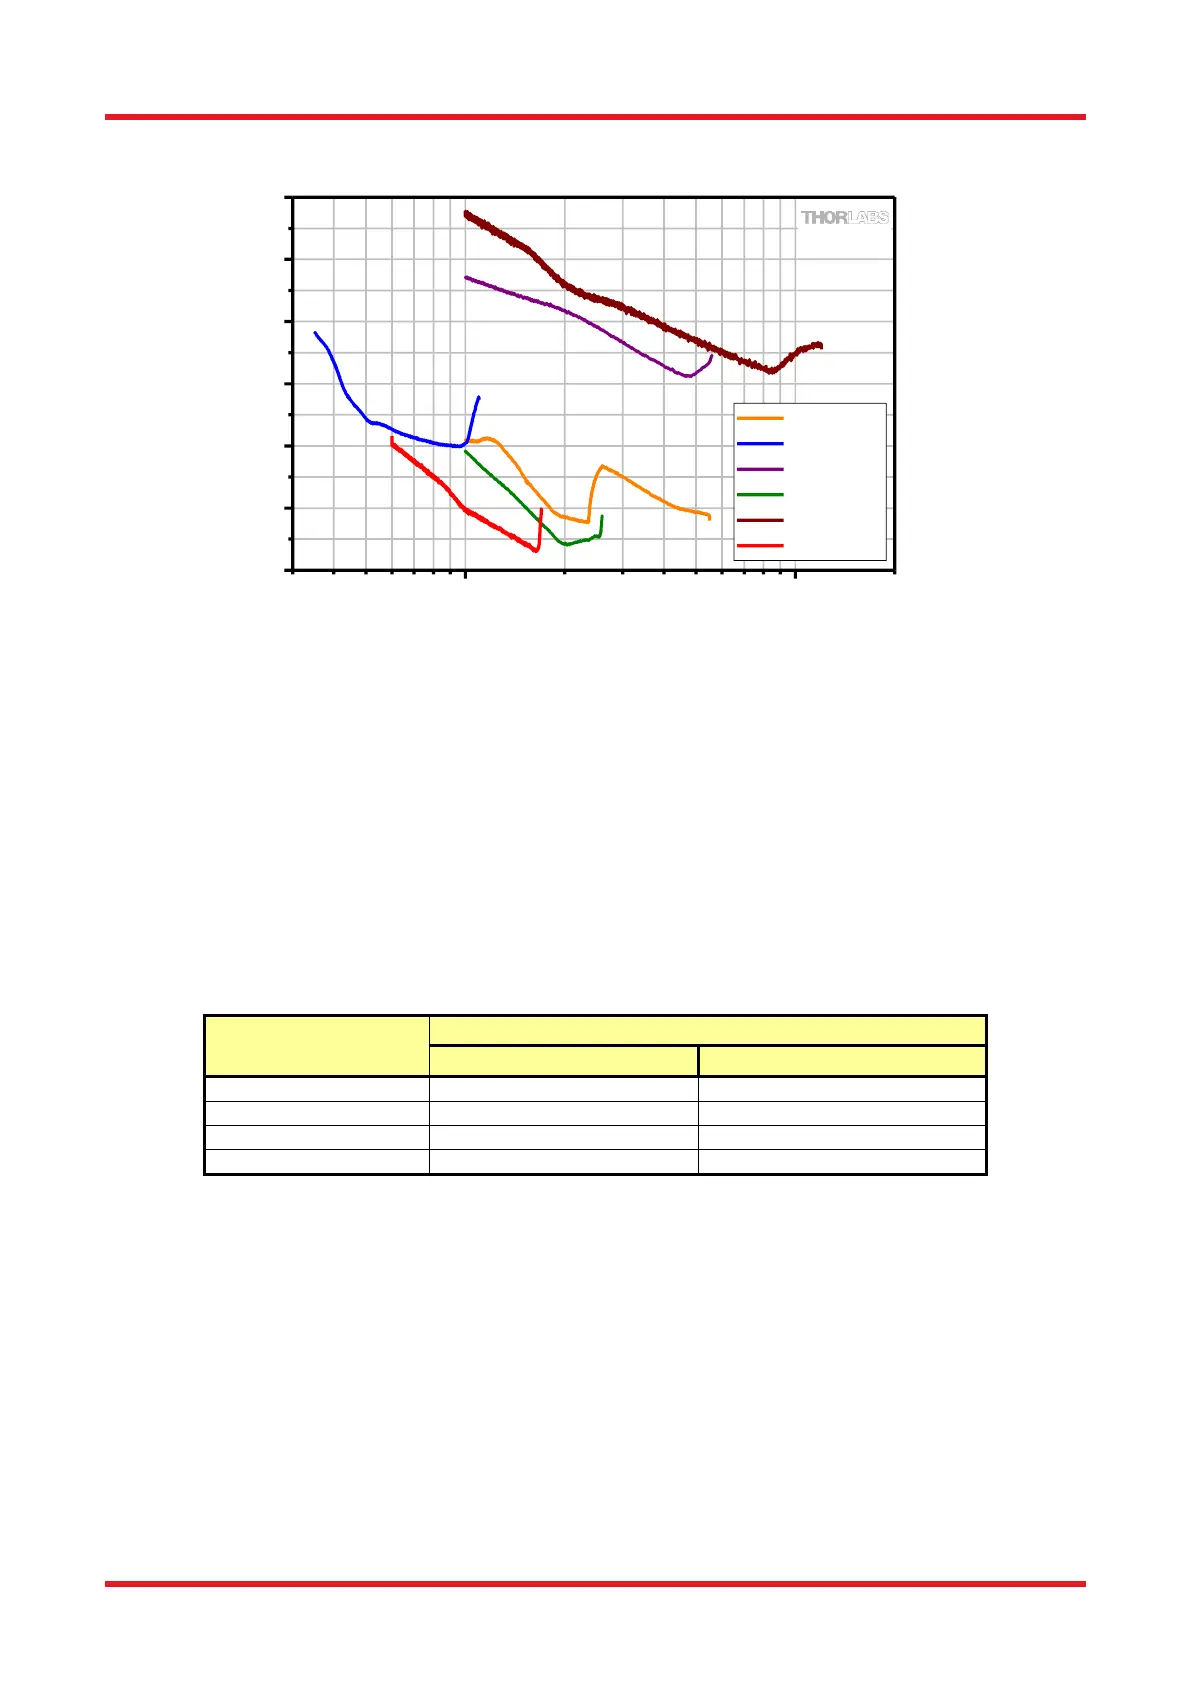
Figure 4. Noise Floor in Power Density Mode
4.8. Dynamic Range/Optical Rejection Ratio
The ability to measure low-level signals close to a peak is determined by the optical rejection ratio (ORR) of the
instrument. It can be seen as the filter response of the OSA, and can be defined as the ratio of the power at a
given distance from an interesting peak to the power at the peak.
If the ORR is not higher than the optical signal-to-noise ratio of the source to be tested, the measurement will
indicate the limit of the OSA rather than the tested source. Figure 5 and the table below provide some example
values for the optical rejection ratio of the Redstone OSA305 for a narrowband source at 1532 nm with the
following settings: High Resolution, Low Sensitivity, average of 5 traces, Hann apodization, and Zero Fill = 2.
Values for the OSA205C are included for comparison. All OSA20xC models and the Redstone OSA305 show
similar behavior if the distance from the peak is measured in frequency, e.g., GHz.

 Loading...


