Redstone™ Optical Spectrum Analyzer Chapter 8: Operation
Page 27 STN053070-D02
Figure 22. Displaying a Legend in the Data Display
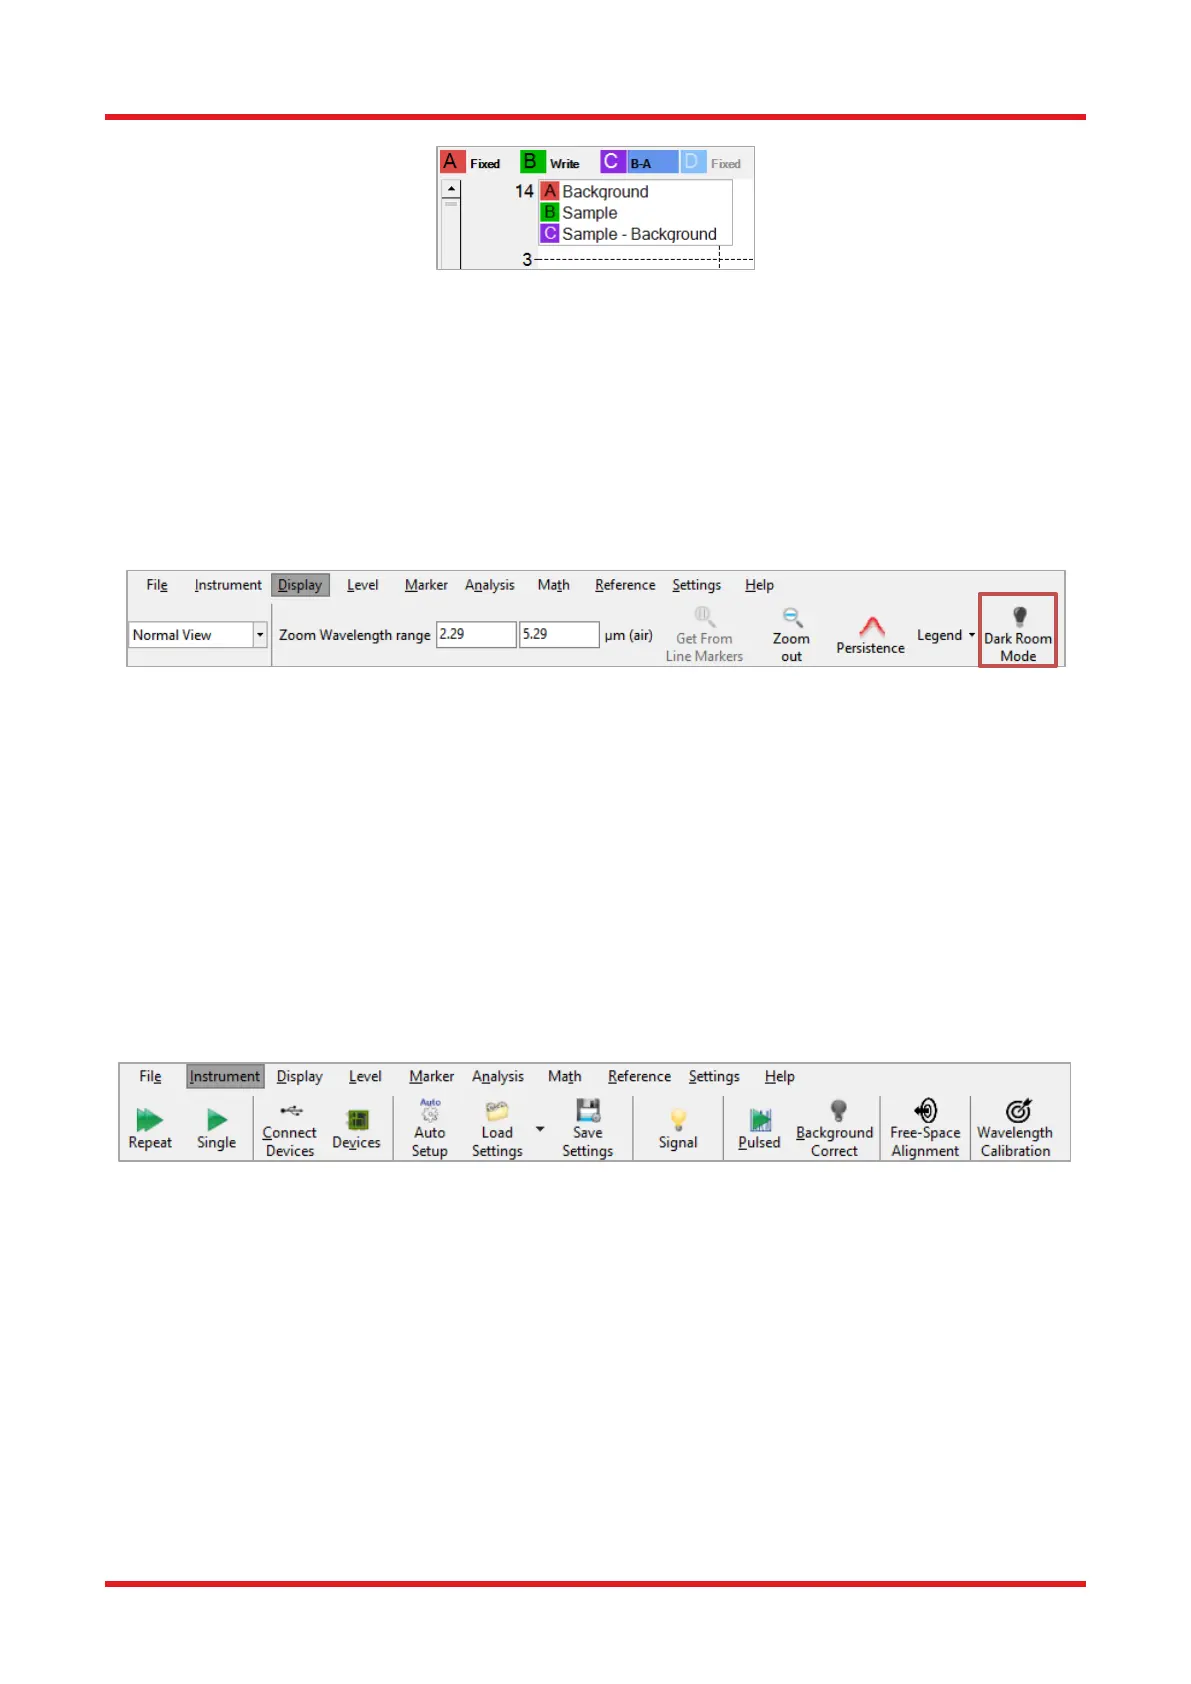
8.3.12. Dark Room Mode
If the screen is too bright, the graph background and grid color can be easily changed by clicking the “Dark
Room Mode” button under the Display menu. The background color will turn black and the grid color will turn
white. Click the button again to revert the graph background color to white and grid color to black.
Certain analysis tools will be affected by the Dark Room mode. The affected analysis tools are Wavelength
Meter (Section 8.9.3), Coherence Length (Section 8.9.4), and Power (Section 8.9.10). These analysis windows
need to be opened after Dark Room mode is activated in order to be dark.
8.4. Acquiring Data
Spectra are acquired from the active spectrometer (selected in the Device dialog) and processed according to
the current settings.
8.4.1. Finding the Spectrometer
When the software starts it will automatically detect and read the properties of all Thorlabs spectrometers
connected to the computer through USB. If the program was started before the instrument was connected or
powered-on, the software will not be able to find the instrument. To search for connected spectrometers, press
the “Connect Devices” button found under the Instrument menu. This will cause the software to search all USB
ports for connected Thorlabs spectrometers as well as read their properties and settings. Note that the software
interface may freeze for a short while during the time in which the scan is performed. If the device cannot be
found please see Chapter 12 Troubleshooting.
Figure 24. Instrument Menu
8.4.2. Selecting with Which Instrument to Work
If several instruments are connected to the PC, the most recently connected OSA will be selected as the Active
Device. All changes to acquisition options will be realized on that instrument and the measurement buttons
“Single” and “Repeat” will control the Active Device.
The Active Device can be changed by selecting a different device from the drop down list of devices found on
the leftmost side of the screen, just above the Trace controls, see Figure 25.

 Loading...


