Redstone™ Optical Spectrum Analyzer Chapter 8: Operation
Rev C, January 21, 2022 Page 48
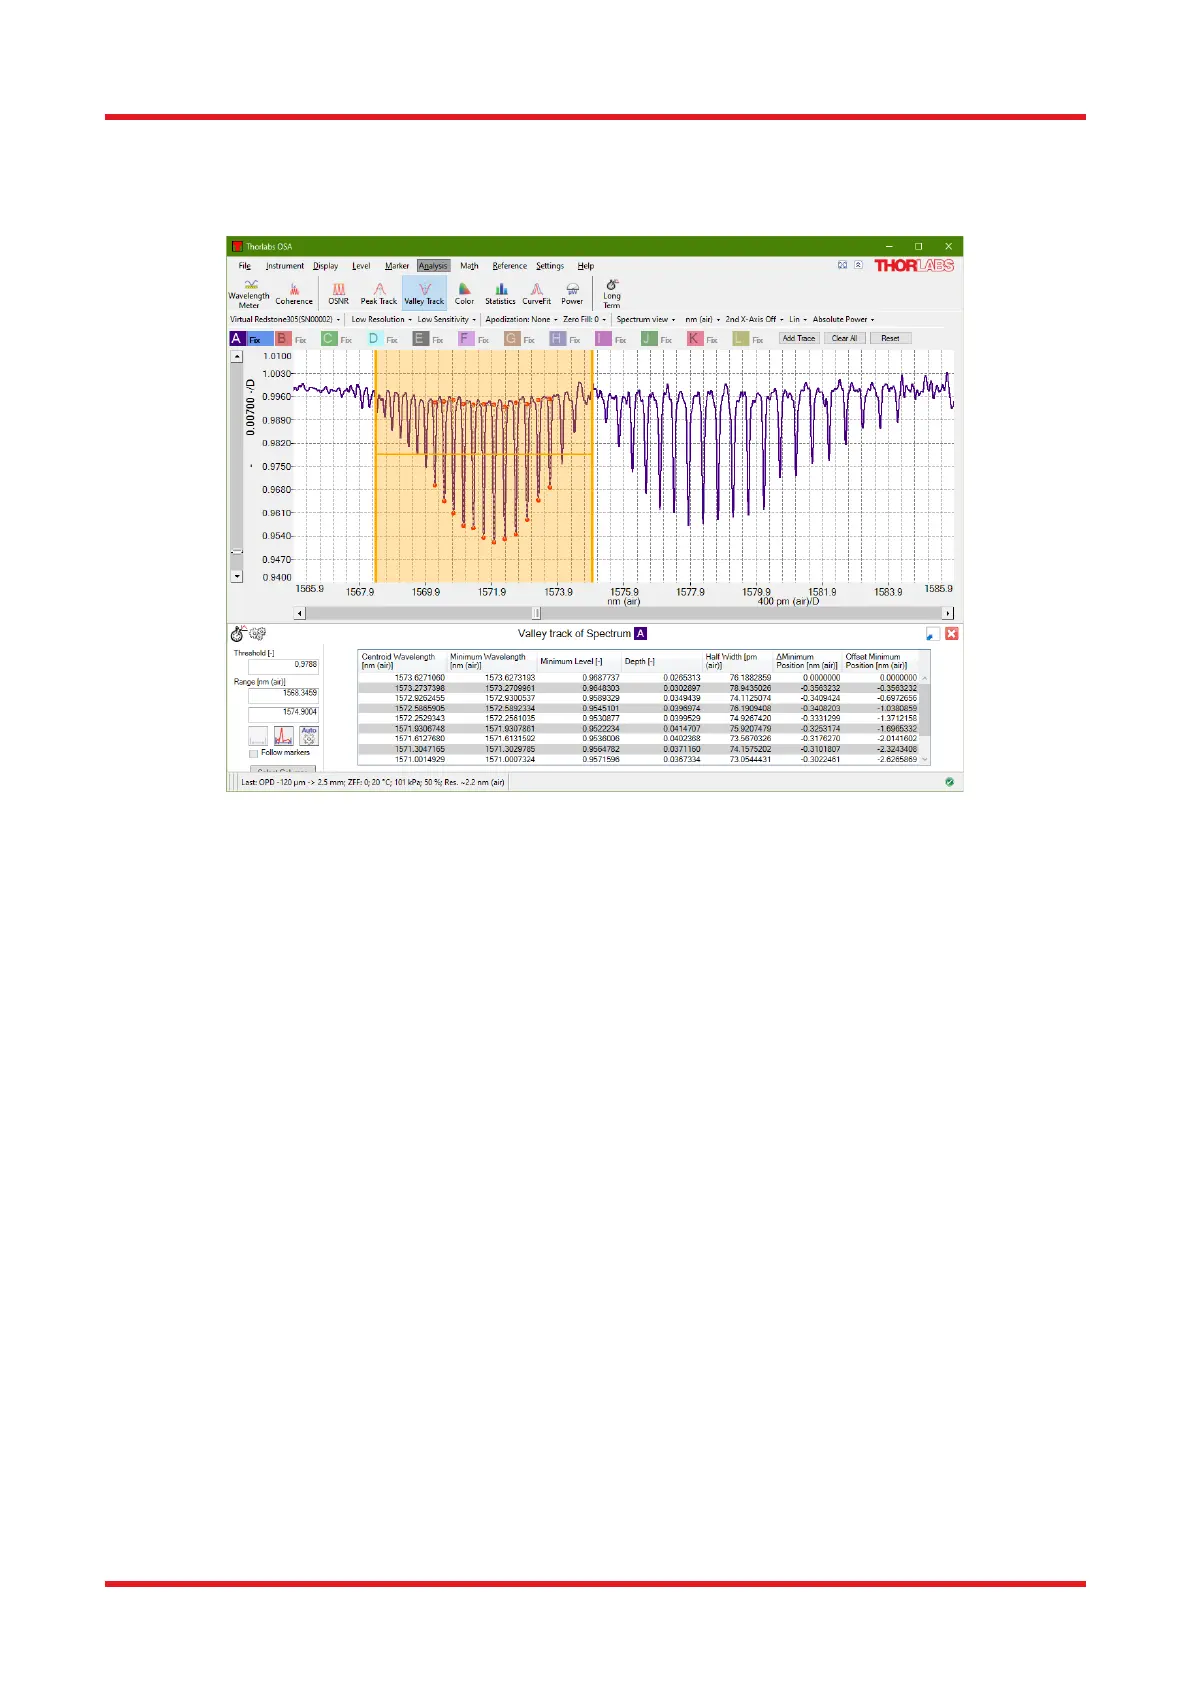
If no valleys are found by the Valley Track tool, check the Threshold and Min valley depth settings to make sure
that the expected valleys in the spectrum are deeper than these constraints. The settings can be changed
directly in the tool options panel found to the left of the data table in the Valley Track analysis window.
Figure 49. Valley Track Tool with Range and Threshold Lines (in Yellow)
8.9.8. Statistics Analysis
Statistics Analysis allows several statistical parameters of a trace to be analyzed and tracked over time over a
user-specified x-axis interval. It is possible to statistically analyze raw data (i.e., live spectra and/or
interferograms), calculated values (i.e., transmittance or absorbance), and arbitrary user-defined traces (e.g.,
traces composed from algebraic manipulations of other traces).
When the Statistics Analysis is enabled, the statistics analysis window is displayed in a floating window or
docked below the main display area, as described in Section 8.9.1. This window contains a data table with
statistical information about the Active trace over the x-axis range defined by the values in the boxes in the tool
options panel. Either end of this range can be changed either by typing new values into the boxes or by dragging
the range lines in the main data display area (described in Section 8.9.2). Changes will take effect immediately.
Movable markers 1 and 2 (see Section 8.5) can also be used to specify the analysis area. When these markers
are enabled, a “Get From Markers” button located under the two input boxes is activated. Clicking this button
defines the endpoints of the analyzed interval as the locations of the two movable markers and recalculates the
result.
Finally, the interval can also be defined by the current displayed range of the main data display range by clicking
the “Use Displayed Range” button below the input boxes. Note that the input boxes are only visible if the window
is large enough.
Note that zooming or scrolling the graph will not automatically change the interval.
The following statistical parameters are available:
• Mean: The mean (average) value of the trace over the analyzed interval.
• Variance: The sample (i.e., not the population) variance of the trace over the analyzed interval. This
is calculated using the following formula:

 Loading...


