Redstone™ Optical Spectrum Analyzer Chapter 8: Operation
Rev C, January 21, 2022 Page 60
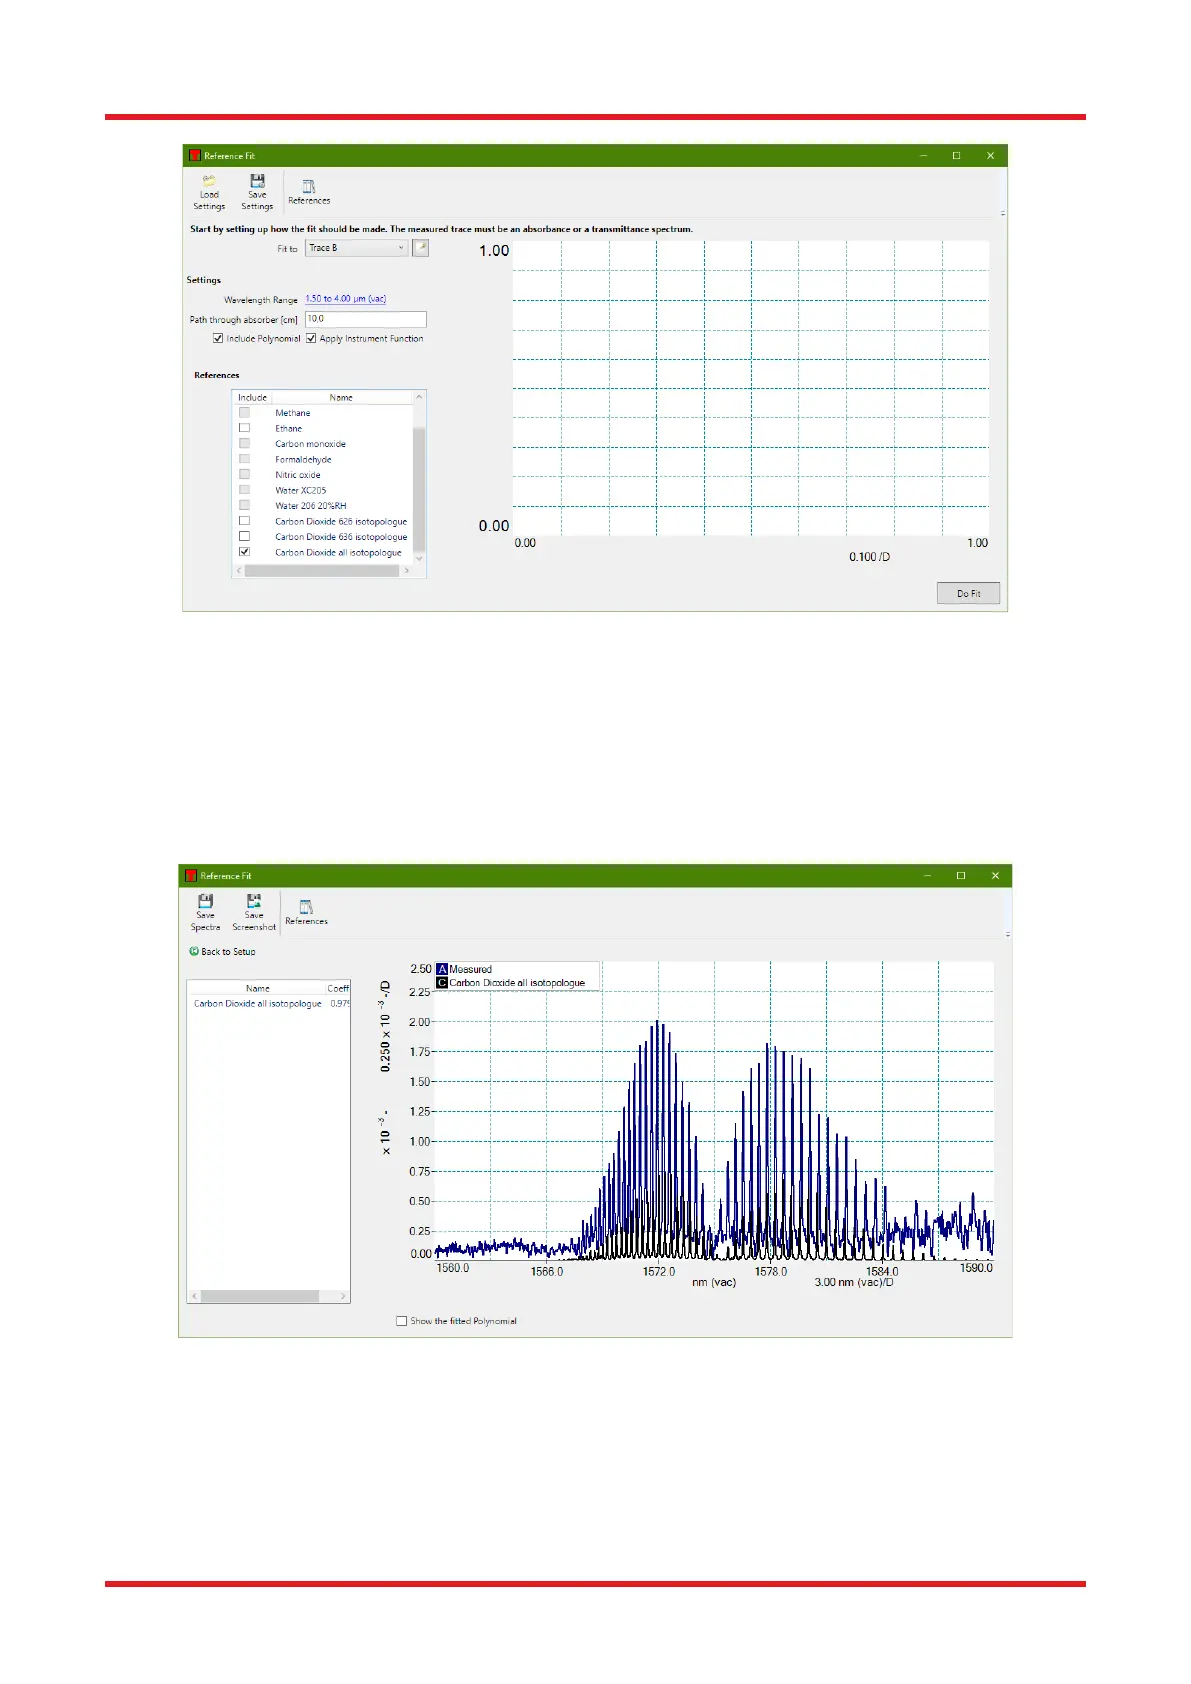
Figure 62. Setting Up a Fit in the Reference Fit Window
The wavelength range over which the fit is performed can be changed by clicking on the blue, underlined
wavelength range in the Settings section. To perform the fit, click the “Do Fit” button. The Reference Fit dialog
box will then contain a graph that displays the measured spectrum, each scaled reference spectrum, and the
sum of all the reference spectra. To the left of the graph is a table that displays the fit coefficient for each
reference spectrum that was used.
To try a different setup, click the “Back to Setup” button.
Figure 63. The Result of the Fit Displayed in the Reference Fit Window
8.10.3. Baseline Correction
As shown in Figure 6463, the Baseline Correction function removes baseline absorption from an acquired
spectrum.

 Loading...


