Redstone™ Optical Spectrum Analyzer Chapter 8: Operation
Page 45 STN053070-D02
not be equidistant). Next, the average intensity around the left midpoint and around the right midpoint is
calculated. These are the so-called left and right noise areas. Finally, the noise at the peak is linearly interpolated
based upon these two values and their distance from the current peak.
For the first and last peaks in the spectrum, it is not possible to define a left midpoint or a right midpoint,
respectively. Therefore, for these two peaks, the average distance between all of the peaks in the spectrum is
used to define the left noise area and the right noise area. The left noise area of the first peak is defined by the
position of the first peak minus half the average peak distance, while the right noise area of the last peak is
defined by the position of the last peak plus half the average peak distance.
When only one peak is present in the spectrum, the noise is calculated by first finding the points to the left (and
the right) where the (smoothed) first-order derivative is no longer positive (or negative). The noise at the peak
is then the linear interpolation of these two values.
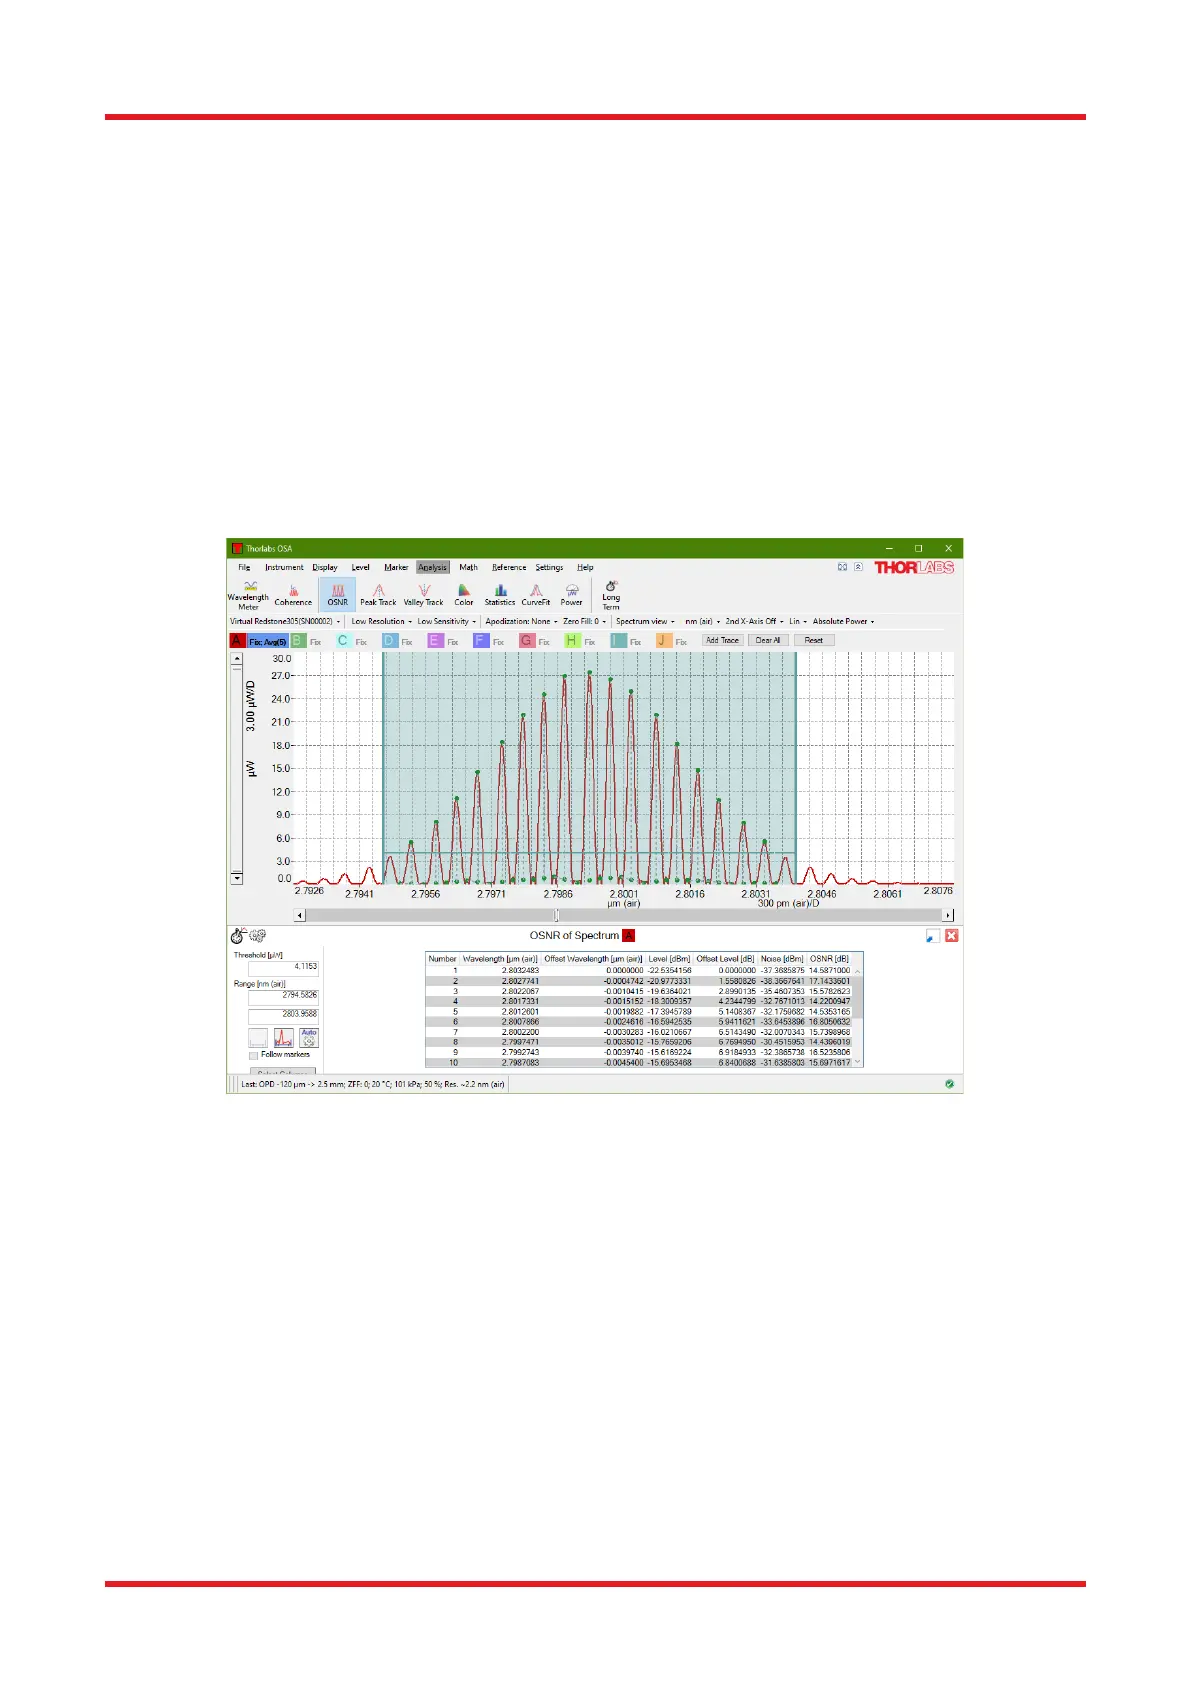
The OSNR tool analysis window is by default displayed in the region below the main data display area, but can
be displayed in a floating window (see Section 8.9.1).
Figure 47. Optical Signal-to-Noise Ratio (OSNR) Analysis Tool
8.9.6. Peak Track
The Peak Track analysis tool is only available in Spectrum view.
Through the Peak Track analysis tool it is possible to track the position, amplitude, and width of peaks in the
spectrum over time. The maximum number of peaks that can be simultaneously tracked is 2048.
When the Peak Track tool is active, the peak track analysis window will by default be displayed below the main
data display area (see Figure 4847). Here, a data table shows information about the peaks, as well as a small
toolbox with the settings that were used to find the peaks. It is also possible to select which columns are
displayed in the data table by clicking on “Select Columns.”
The criteria used to find the peaks are:
• Threshold: Only data points with values higher than the threshold will be considered when searching
for peaks.

 Loading...


