Redstone™ Optical Spectrum Analyzer Chapter 8: Operation
Rev C, January 21, 2022 Page 46
• Range: Limits the x-axis range over which the search for peaks is performed.
• Maximum Number of Peaks (found in the Settings dialog box behind the cogwheels icon): Limits the
number of peaks returned by the Peak Track analysis tool. The default value is 200 peaks; the maximum
value is 2048 peaks.
• Min Peak Height (dB) (found in the Settings dialog box behind the cogwheels icon): Only peaks which
have a peak-to-baseline ratio of at least this value will be returned.
When the Peak Track tool is active, the currently Active spectrum trace is checked for peaks upon the collection
of a new spectrum from the instrument. By default, the peaks are sorted in order of decreasing intensity. Right-
clicking in the data table brings up a contextual menu from which it is possible to save the data in the data table
to file or copy the data to the clipboard for analysis in another software.
The peaks found in Peak Track can be tracked over time in a Long-Term Analysis (see Section 8.9.11). Note
that since the peaks are ordered by decreasing intensity, they will be rearranged if the relative intensity of the
peaks in the spectrum changes.
If no peaks are found by the Peak Track tool, check the Threshold and Min Peak Height settings to make sure
that the expected peaks in the spectrum are higher than these constraints. The settings can be changed either
in the Settings dialog box (described in Section 9.1.3 Peak Track Settings) or directly in the tool options panel
found to the left of the data table in the Peak Track analysis window.
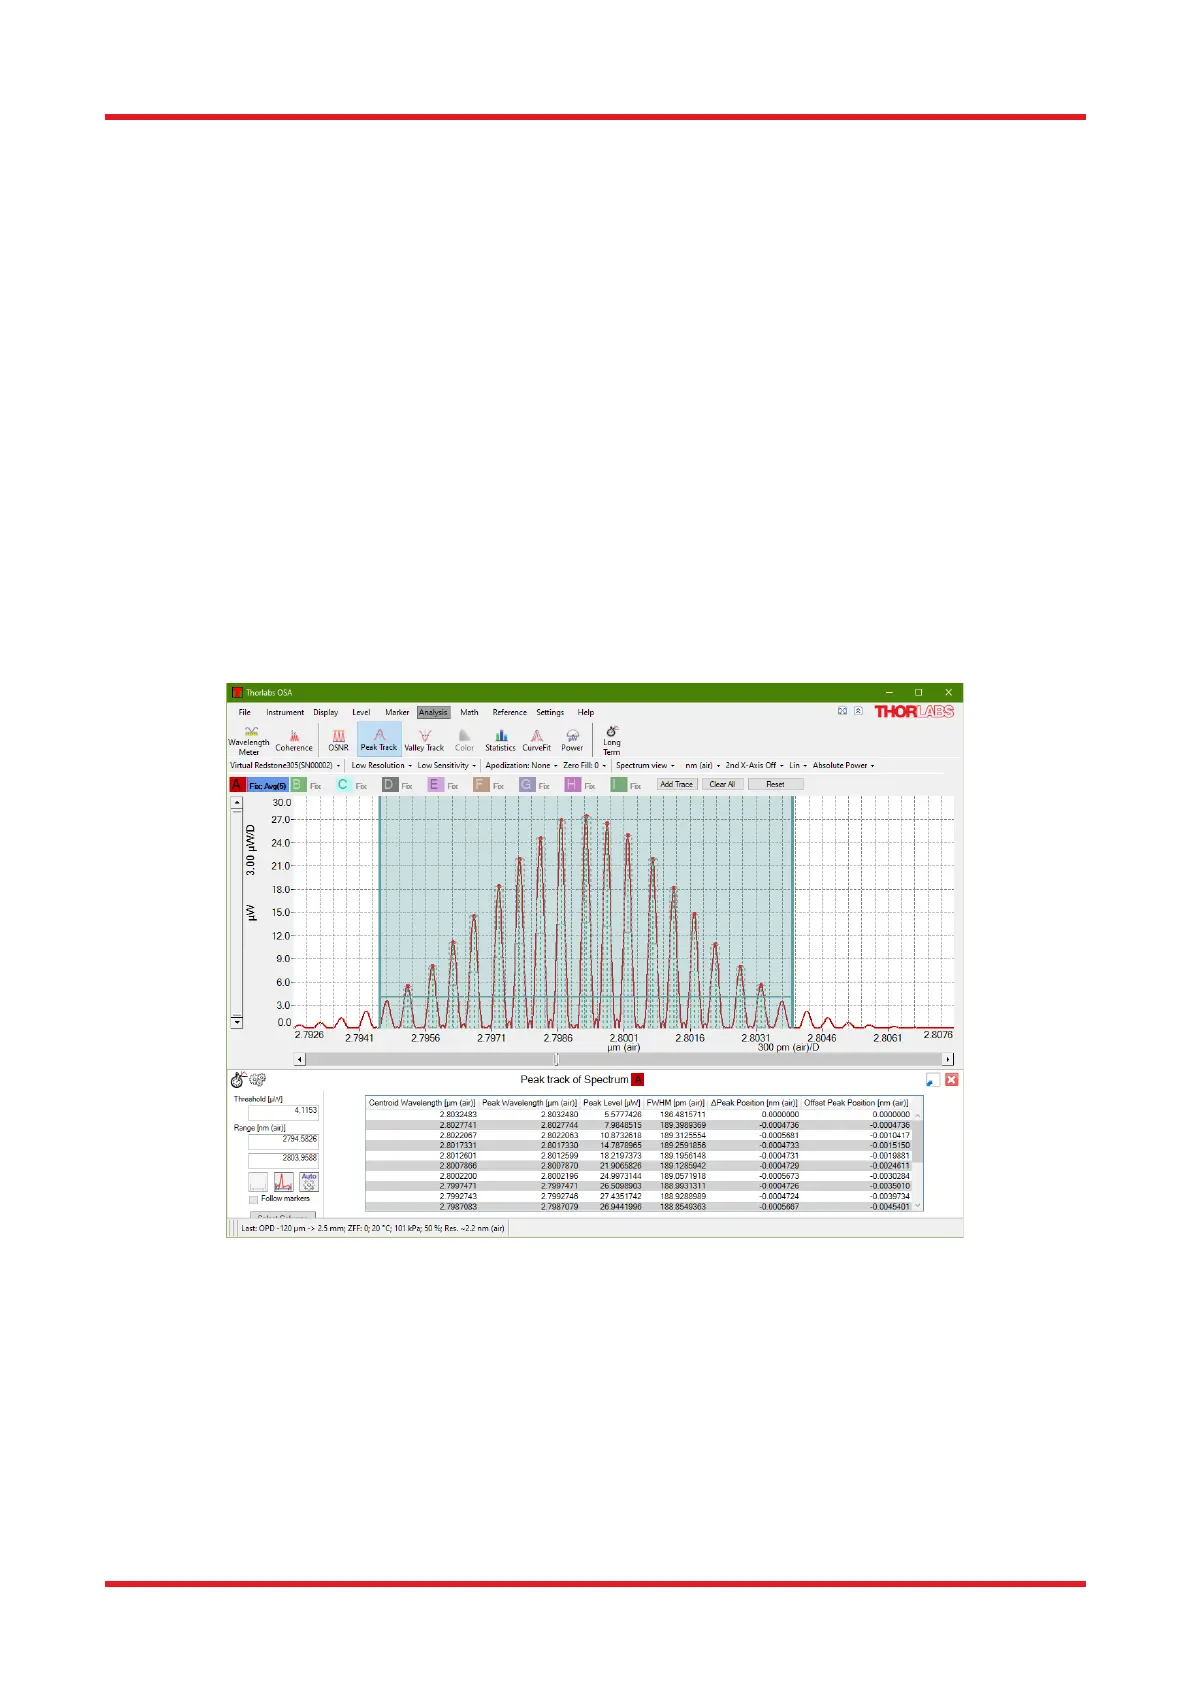
Figure 48. Peak Track Tool with Range and Threshold Lines (in Blue)
For each peak that is found in the currently Active trace, one line is displayed in the table shown in the Peak
Track analysis window (by default found below the main data display area). The data reported for each peak is
as follows:
• Centroid Location: The x-axis location of the center of mass of the peak. This location is determined
from the weighted average of all points whose intensities do not fall below the Min peak height level
defined in the Peak Track analysis window.
• Centroid Level: The value of the trace at the center of mass of the peak, defined as explained above.

 Loading...


