Redstone™ Optical Spectrum Analyzer Chapter 9: Settings
Page 63 STN053070-D02
Chapter 9 Settings
Pressing the Settings button in the main menu will open the Settings dialog. By default, the Settings dialog box
will start in Basic level. To see more advanced settings, press the “Switch to Advanced level” button in the lower
left corner of the dialog.
9.1. Basic Settings
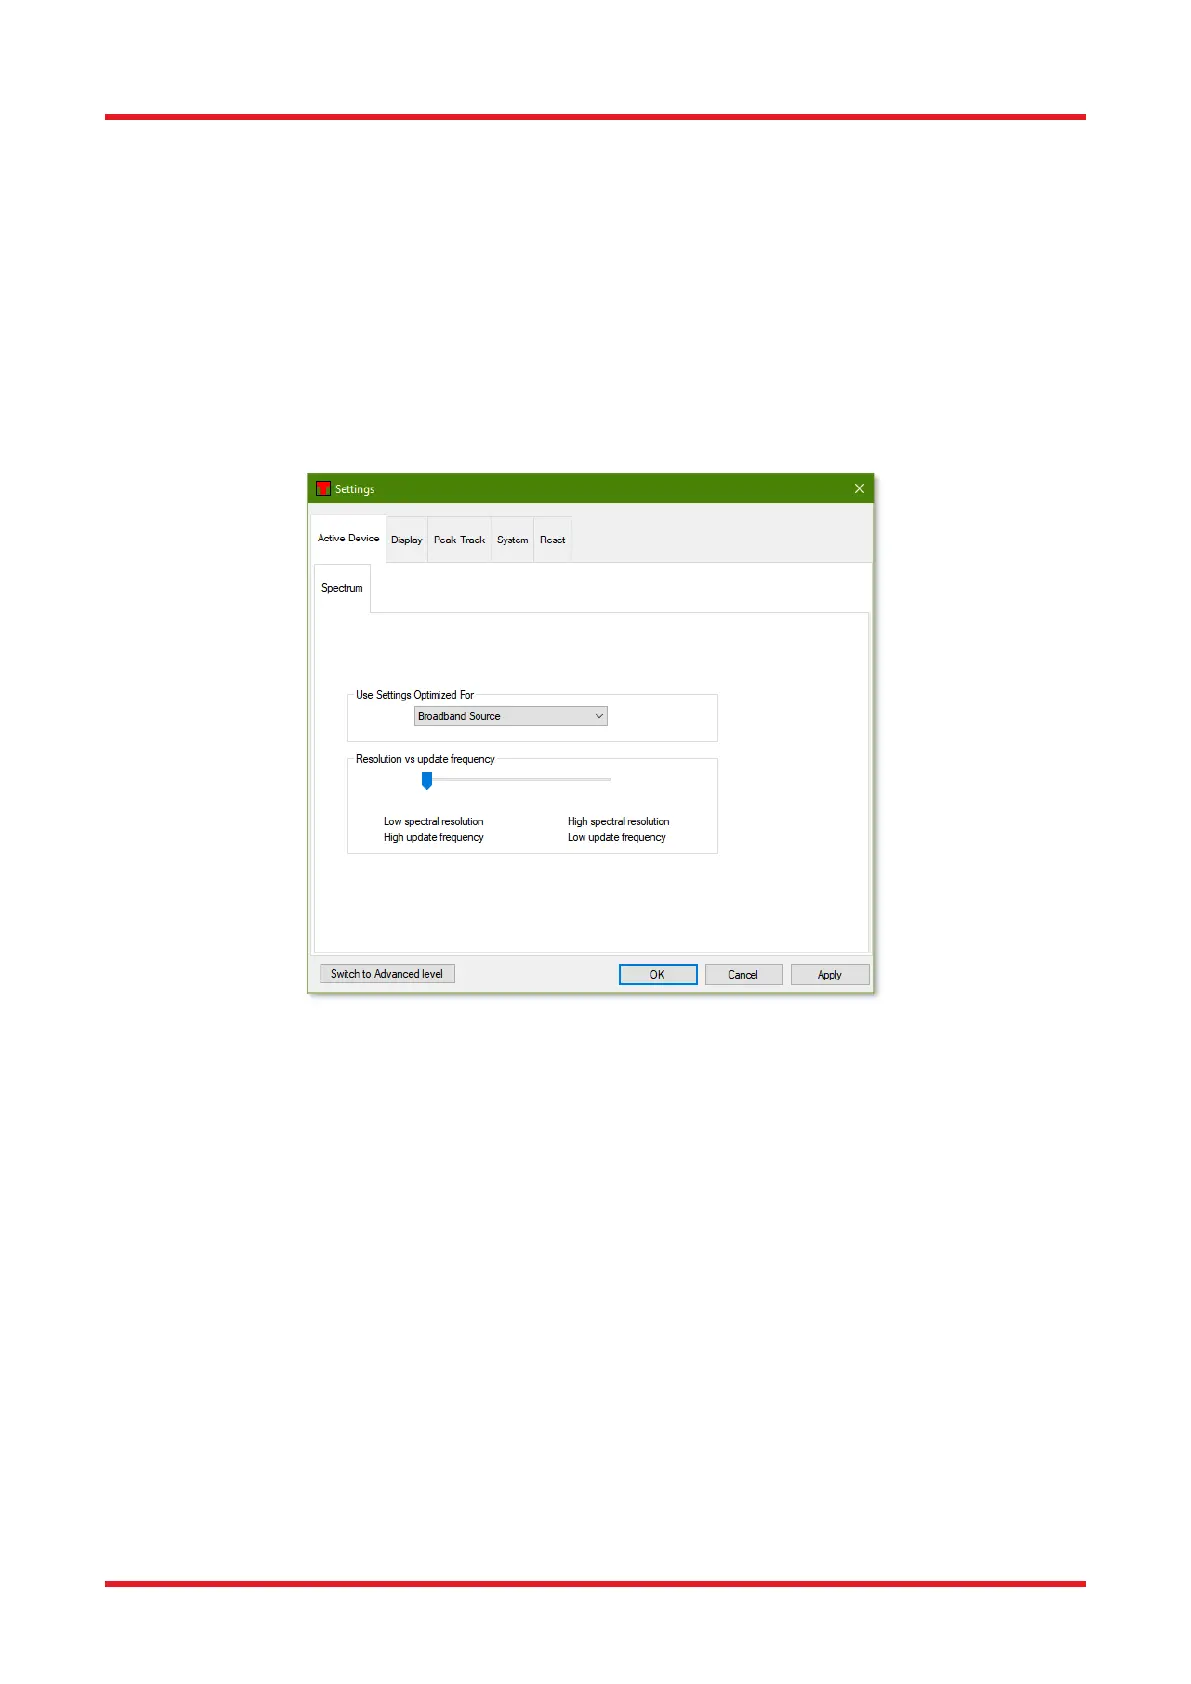
9.1.1. Active Device Settings
The first page in the Settings dialog allows the user to setup the general properties of the data acquisition. The
resolution vs. update frequency slider allows the user to indicate whether to prioritize spectral resolution or high
(temporal) update frequency.
Figure 65. Spectrum Setup Page in Basic Level
9.1.2. Display Settings
On the Display page it is possible to change the properties of the display, such as the background color of the
display and the number of traces used. Note that the color of each trace is not changed here; instead see
Section 8.7 Working with Data in Traces.
The Line Width option changes the width of the lines used for drawing the traces in the main data display. Using
thicker lines can be beneficial if the screen is located at a distance from the operator or the screen is hard to
read.
The legend combo box enables or disables the legend of the main data display area and makes it possible to
select what text data to display in the legend, see Section 8.3.11 Displaying a Legend in the Data Display Area.
If the check box “Show Individual Data Points” is checked, the display will show crosses at the individual data
points in the traces when the graph is zoomed in so much that only one hundred data points are drawn.
The check box labeled “Interferogram in Percent” (only available in Advanced level) toggles between showing
the interferogram as percent of the full measurable range (default) or in “counts” on the ADC. See also the
Section 8.3.5 Setting the Unit of the Vertical Axis.

 Loading...


