Redstone™ Optical Spectrum Analyzer Chapter 8: Operation
Rev C, January 21, 2022 Page 20
Chapter 8 Operation
8.1. Interface Overview
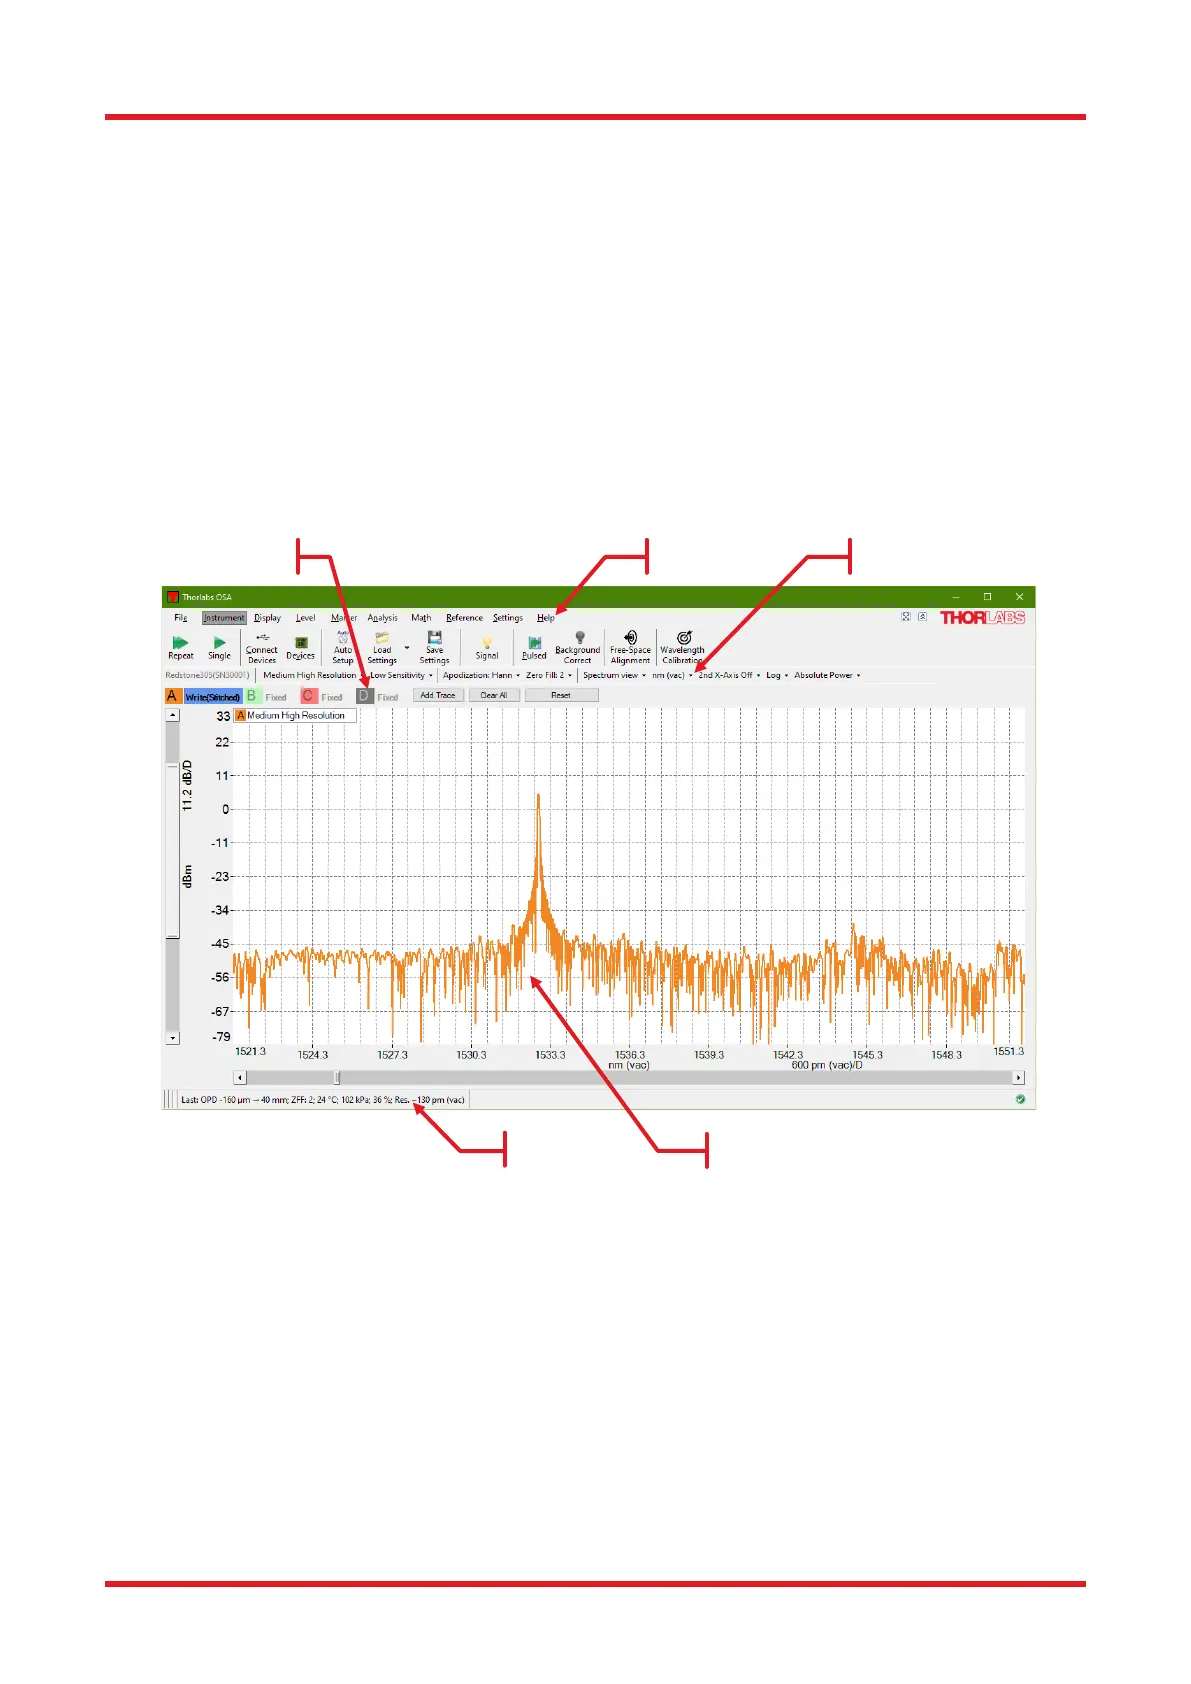
When the Thorlabs OSA software is first started, the main window is composed of five areas:
• Main Menu: contains the command buttons
• Settings Bar: provides quick access to the settings of the software
• Trace Controls: contains the trace options
• Data Display Area
• Status Bar
Figure 14. Layout of the Main Window of the Thorlabs OSA Software at Startup
The data display area contains a graph showing the values of the currently loaded traces. The display area is
capable of showing two vertical axes, one primary with its unit and range shown on the left hand side of the
graph and one secondary with its unit and range shown on the right hand side of the graph (only displayed when
any trace is drawn on the secondary vertical axis). In the background is a grid with 10 by 50 divisions
(customizable) displayed.
8.2. Spectrum View and Interferogram View
The Thorlabs OSA can be operated in one of two views: Spectrum view or Interferogram view.
8.2.1. Spectrum View
In Spectrum view,
• Only spectra are shown

 Loading...


