Redstone™ Optical Spectrum Analyzer Chapter 8: Operation
Page 51 STN053070-D02
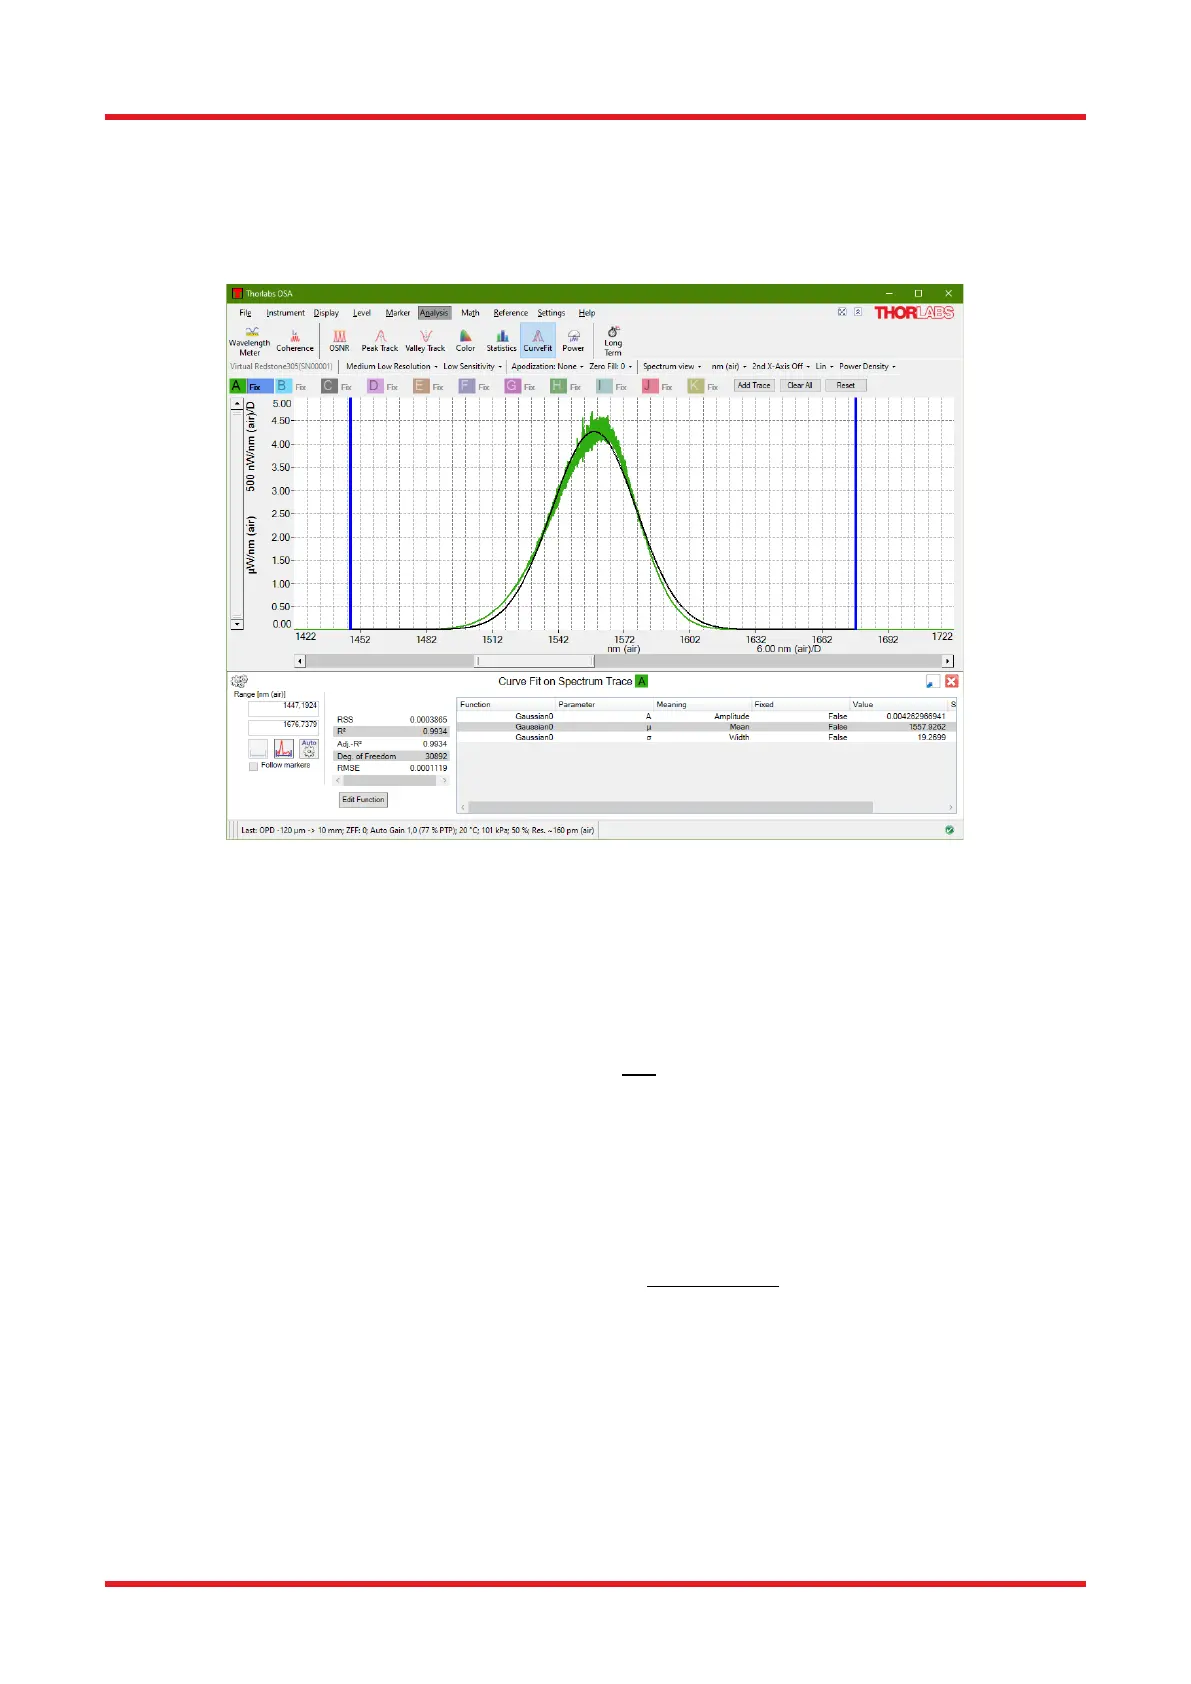
Getting the Result
When the fit is finished, the fit parameters as well as the values and standard errors thereof are displayed in a
table in the Curve fit tool window. The fitted curve is also overlaid on the data in the main data display area for
visual inspection.
Figure 52. Curve Fit Tool
The middle table shows the properties of the fit itself. The following parameters are displayed:
• RSS (residual sum of squares): This is the sum of the squared differences between the fitted function
and the trace, taken over all data points included in the fit.
• R
2
: This is calculated as:
where is the residual sum of squares, and is the total sum of squares, calculated as the sum
of the squared differences between the trace and the average value of the trace, taken over all data
points included in the fit.
• Adjusted R
2
: This is the R
2
value above adjusted for the degrees of freedom. This is calculated as:
where is the length of the data set in the fitted region and is the number of fitted parameters.
• Degrees of Freedom: This is the length of the fitted data set minus the number of fitted parameters.
• RMSE (root mean square error): Calculated as the square root of the RSS divided by the degrees of
freedom.
8.9.10. Power Analysis
The Power Analysis tool is only available in Spectrum view.

 Loading...


